Plays here from YouTube when you press play. Open on YouTube
Published . Prices, rates and counts in this video were current on that date. This month's numbers are on Market Data.
What is this video about?
“Atlanta's Housing Market Update (January 2026)” is a 44-minute video by Terence Richardson, a Realtor with Compass in Metro Atlanta. It was published on January 13, 2026 on his YouTube channel, Terence Richardson - Atlanta Real Estate.
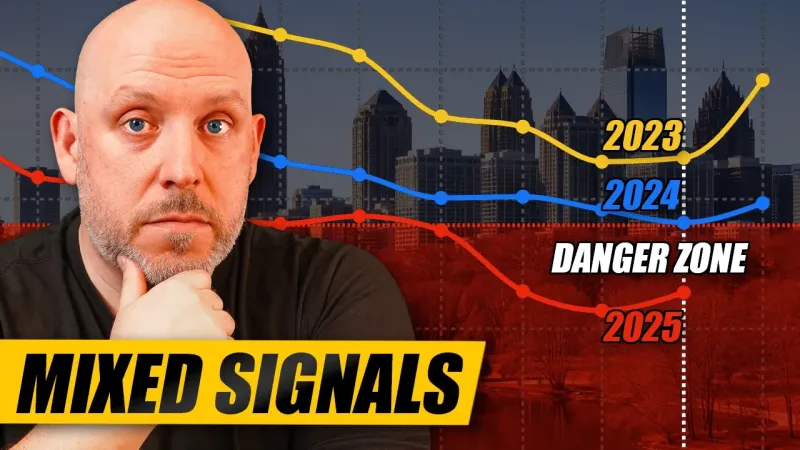
One Atlanta real estate market indicator just hit the danger zone. In this video I explain what's happening in the market and how to navigate it as a buyer and/or as a seller.
Transcript
This comes from YouTube’s automatic captions, set into paragraphs. Place names the captions misspelled were corrected. 11 figures or words the captions misheard were corrected after checking them against the video’s script or a second transcription. Nothing else was added or reworded. Captions can still mishear a word or a number, so check a figure against the video before you rely on it. Captions read November 16, 2026.
Market introduction 0:00
It's 2026. Interest rates have been on a downward trend over the last couple of weeks. Now, that bodess well for this year's market. In this video, we're going to take a look and see how we wrapped up 2025, understand where the market is going in 2026. I'm going to let you know in December, the market didn't do so hot, but I found 10 zips where the market in these specific parts of metro Atlanta completely outperformed the market.
So, that and more coming up in this month's edition of the Atlanta Housing Market Update. Let's get right into it. Can I just say that it's really good to be back. You may have noticed brand new set. I'm done moving with two little toddlers. Everything always takes a little bit longer than you would expect, right? All right, let's jump into it.
Interest rate trends 0:43
Let's start off with the interest rates. So, this is as at the end of the year. I took a look at rates before I jumped into this video. And while we finished the year at 6.15 for the 30-year, we're hovering really close to six right now. We're at 6.01 is the average rate. Now, client went under contract last week on the property, the rate that they were quoted without buying points down, 5.75.
Um, there's a lot of different depending on what your credit is, how much money you're putting into the deal. FHA versus conventional, you're seeing a lot of rates under six. Now, if you're looking at new construction, a lot of these builders, I had a client in town from um Virginia this past week. We were all over metro Atlanta looking at new construction under basically under 600,000. And all of these different builders are offering some kind of interest rate buy down.
Most of them are permanent rate buydown. So, you'll see 4.875, very, very common. 4.99, very, very common. Some of these builders will buy the rate down to 3.99 permanently over the next 30 years and in addition are giving you a 2-1 rate buy down on top of that. So that 3.99 becomes 1.99 first year, 2.99 second year, then the third year back to 3.99. If you're selling a house right now, that's it's tough.
It's tough to compete with the incentives that builders are giving because as a seller when you can offer 10, 15, potentially $20,000 towards closing costs and or rate buy downs. Some of these builders, they're giving 60 70 $80,000, right? So, it's it's challenging, but not impossible. Not everybody wants to wait for a brand new house, and not everybody likes the way that builders will spec them out. And there's a lot of builders that are cutting corners.
They're putting cheaper materials. I can't tell you how many houses we saw where they're wrapping houses in cardboard. Now, it's not even OSB, right? So, anyways, rates are trending down. I expect they're going to trend down further this year. There's going to be a change happening at the Fed. I think Jerome Powell is going to be out. Somebody new that's going to be a little bit more favorable to cutting the Fed fund rate should be coming into uh that position here.
And from there, there's a lag factor. So, as the Fed meets, if the rate cuts come at uh higher click than 25 basis points, which is what the last three rate cuts have been, and the market responds, it always takes a little while afterwards for interest rates to follow, but it bodess well. I think we're going to see some uh nice rates in the fives being much more common this year than last year.
Median price analysis 3:22
So, let's move on. Now, let's take a look at median price. Now, median price, we're going to break it down by property type. So, overall for Mitchella, it's 423, which is a departure from what the tune that I sang for pretty much the last the last 6 to 7 months of me doing these videos where I'd come on and I'd say that the median price was 425, right? So, the last time that I did one of these videos was month and a half ago and for the first time in months, we went from 425 to 424.9.
And I was joking about that uh that we saw a change, right? Well, we ended December at 423. So now we're starting to see some downward momentum on the median price for Mitch Atlanta. Where we're seeing some of these changes, it's not necessarily happening with single family because you can see here that single family in December of last year was 445, right? Still 4 to 45. So it's in town homes and condos.
So 395 down to 387 is where town homes moved in terms of median price and condos moved from 300 down to 295. So the combination of both of those having downward momentum on median price is moving the metro Atlanta median price down for the first time in a very long time. Basically single family still at the same price that it was. So if we break this down, I'm going to let you take a look at this chart here.
Breaks it down by county. So you can kind of see, you know, Forsyth County has the highest single family median price at 647 and uh Fulton is at 571 right behind it. Condos, you're taking a look at a couple of different things, but Forsyth County is right at 490 with condos. Not the biggest condo market, but the condos that they have, they're expensive like everything else in Forsyth County. Uh town homes also, uh they're at 470.
So all in all with everything that they've been building and all the basically new construction's pushed the price of housing in for county through the roof over the past decade. They've got the highest real estate in every single category right now. So moving on now I do a video like this that is focused on the luxury market and there are luxury markets that are doing far better than what Forsyth County is.
But we're taking a look at the whole market. Forsyth County definitely stands out as you can see.
Inventory and listing updates 5:41
Okay, moving on. Here's what's happening with inventory. Now, as we end the year, it's normal that if you're not selling and you get to the holidays, you're probably thinking about taking a break. A lot of people do that. So, when you're taking a look at the number of active properties, you go from almost 21,000 in the month of October down to 15,623. You're basically losing 25% of your inventory with people taking breaks basically because it's not properties going under contract.
You take a look here at the pendings in October and you take a look at the pendings now, which 3,000 in October down to 2,300 in in um December. But we're going to take a look at this pending number in just a little bit when we look at the pending ratio and how it relates to showings and whatnot. So, more on that in a moment. Now, failures, this is expired and withdrawn listings.
It's no surprise that as we get into the holidays, you see them go up because a lot of properties have well, when you sign a listing agreement with your agents, you're going to have a start date and an end date. A lot of people have the 31st of December as an end date. So on January 1st, many of you watching me right now got a ton of phone calls from real estate real estate agents fishing for a listing.
Am I right? But a lot of these are withdrawns and it's basically just people taking the property off to enjoy the holidays, get through Christmas, get through the new year, and then wait until the uh spring market arrives. So spring market, March onwards, right? You get on the market towards the end of February, you're right at the beginning of that, and you get that upward momentum. A lot of buyers tend to be out in late February, early March, and the most listings hitting the market year-over-year tend to be in May.
So, when you're taking a look at new listings here, you can kind of see that right here, right? That was uh May, uh 9,600 new listings coming to market, and it's an that's the peak this past year. So, it's going to be the same thing this upcoming year. Uh nonetheless, uh this is not surprising. you know, new listings coming to market. Uh let's break this down and we'll see uh for each type by year and kind of get more perspective that way.
So, we pretty much were above the past two years with new properties coming to market every single month this past year, right? Then once we got uh towards the end of summer and into fall, we fell in line with all of the other years. And then we finished the year right in the middle with new properties coming to market in December. Okay, so that's fine. We're average there in terms of new listings by county.
Take a look at the four big counties, right? Cop, DeKalb, Fulton, Gwinnett. You take a look and new listings in December are down significantly in all four of these counties. Uh they're up in a couple of counties, but the rule is less listings year-over-year in December. Where are they up? They're up in Cherokee a little bit. They're up in Paulding a little bit. And I guess you could say Rockdale. one extra listing year over year.
And the same thing with Fate, right? Forsesight's roughly the same. These are the counties that carry metro Atlanta and every single one of those saw less listings year-over-year.
Active market inventory 8:53
Now, as we go into active listings by month for the whole year, we outperformed the last two years. Now towards the end of the year as those listings are coming off the market, it's understandable. But nonetheless, uh there were far more properties to choose from and that's that's a part of it. You're as a buyer, this is where I think it's going to be really great this upcoming year. you have with interest rates potentially coming down, you're going to have people who've been on the sidelines.
People who would love to sell their house, but they don't necessarily want to trade like a 2 and 1/2, 3%, 3 and a half, even a 4% interest rate for something in the high sixes, right? Or mid sixes. But something in the fives now, maybe you're taking that chance. Maybe you're going to go out and up rightsize the house. Maybe you need more space. We're in that market. Not necessarily this year.
I'm going to be buying next year or selling our house this year though. Um I the house that we bought never bought it to have all these kids in it. Now with two kids and we need more space. We have to upsize. But we have a 2.5% interest rate and it's going to make the house more interesting to market because you can assume the rate that we have in our house and then get a piggyback loan for the difference.
2.5% is going to be a really attractive rate in this market. But you can do that as a buyer if you have you're looking at houses that have an FHA loan or a VA. Even though you're not you don't have to be in the military or related to somebody in the military in order to assume a VA loan, anybody could do it. Uh and if you assume that loan, you assume the rate.
And if you don't have the cash to pay the difference between the mortgage balance and the purchase price on the house, which is what you have to do when you assume the rate, there are companies out there, financial organizations that will give you a piggyback loan for a second to cover the difference. It's usually up to 90%. So, you still have to have roughly 10% to put down, right? If you're looking at putting less down, uh the assumable road route is not going to work for you.
Nonetheless, I think it's going to be really interesting to see. I think you're going to have a whole bunch more active inventory as people who have been on the sidelines enter the market because now they're done waiting. You can only wait so long before you have to get on with life. And I'm thinking that that's what's going to happen this spring market. So, I think it's going to be a really good spring market.
Okay. So, active listings by county. See what the breakdown is here. Right. Pause it if you want to look. As a matter of fact, all of these slides are available for free. No sign up required. Click the link in the description. That first comments, they're all there for all the previous months as well. So, you don't even have to sign up and give me your email and your name. It's just there.
Click. Enjoy. Okay. Uh so, you can look at this anytime. If you want to pause it to look here, if you want to just look at the slides, hey, have at it.
Pending and closed activity 11:51
Whatever is easier for you. Uh taking a look at pendings. Now, we were in line with the last two years up until we got to the fall market, right? So, Q4 was particularly rough for properties going under contract. A lot of people just took a step back and said, you know what, we're going to go look at houses and we're going to look at the showing activity here in a bit, but not going to buy them.
Now, why do you think there are less properties going under contract? You know, drop a comment. Let me know your thoughts. will be curious to read what you have to say. My thoughts basically is that you just have a lot of people who for from an affordability standpoint rates were still in the mid60s, low to mid sixes right this past quarter. And you it's that itch that wants to get scratched. The people that are on the sidelines, they want to be able to do something, but it's kind of like they're putting their toe in the market, but they're not yet ready to take the plunge.
I'm going to show you this as we look at showing data soon. I think that's part of what I think is happening. What do you think? Let me know in the comments. Okay, moving on. Pending listings by county. So, the big four, you can see how these drops were year-over-year in Cobb, in DeKalb, in uh Fulton, and over in Gwinnett. These are not insignificant drops. Like that's 150 less pendings. This here's 160.
This here's 170. And then here, this is almost 200 less properties going under contract in Gwinnett, for example. So, these are big differences. In some of these other counties, it was roughly the same. Take a look at DeKalb, I'm sorry, Douglas, rather, Rockdale. Uh, but you have downward momentum in in most of these counties. So, closings by month, kind of the same thing, right? If you don't have properties going under contract, well, they're not going to close.
So, in Q4, you saw less properties going under contract. You're going to have less closings as we enter when I do this video in the next couple of weeks for the month of January. Once it's February, you'll see that this is also going to be under the trend lines because we had less properties going under contract a couple months ago. So 30 to 60 days to close on a house. If you're not going under contract, you can't close that house.
So that's what's happening here. That's why you've got that spread. Otherwise, for most of the year, we were locked up with the last two years, right?
Failed listings and trends 14:13
So, taking a look at closed listings by county, we just talked about the big four having a big drop over the last uh this year compared to the last two years. It's no different for closings, you know, big drop, big drop, big drop. And these are big big drops, right? Significantly less closings happening over here in Fulton and Gwinnett's. But hey, carbon decantly less as well. So, very interesting way to end a year.
That's why I say like the way that we ended the year is not great, but I'm still optimistic about what's coming. And a little bit later in this video, I've got 10 zip codes that are just they're defying conventional wisdom. And you'll see because I'm going to talk at some point about the number of properties that are selling for above asking because there are still properties that are selling for above asking.
And in these specific zips, it's not just a small fraction of the listings that are selling for above. It's 30 40% and more. It's It's mind-blowing. Okay, that's coming up. So, failed listings all throughout the year, more expireds, more withdrawns than at um any point over the last two years. We're ending December with more as well as compared to the previous years. And that's a big jump up, right? It's a thousand more a little bit over more than a thousand more properties failing in the month of December this year compared to last year.
That's a big jump from 2023. I mean, it's that's more than twice as many over a 2-year period. Okay. So, when we look at how it breaks down by county here, we're only looking at the last two years. Blue has been our 2025. Here, black is. So, big jumps up, big jumps up in DeKalb, Fulton, and Gwinnett. little bit of a jump up. I mean, it's still a significant jump up, but not like DeKalb and uh Fulton over here in Gwinnett.
So, you can see where where properties are failing more frequently broken down by county.
Market balance ratios 16:14
Now, that brings us to our pending ratio. Now, pending ratio is a ratio that I've been talking about more frequently in recent videos. I'm going to get a little bit more technical with why it's a really good ratio to look at. Before I do, when we talk about a balanced market, generally the measure, the golden standard is to look at months of supply, months of inventory, right? And I've got those slides coming up.
And in our market, it's different everywhere, but for metro Atlanta, generally speaking, 5 to 6 months of inventory is considered a balanced market. Above six, it's a buyer market. Under five, it's a sellers market. Over the past couple years, it's been a very strong sellers market in metro Atlanta. Well, that's changing. We're going to see that here in a moment. In a balanced market, you generally want to see 18 to 25% uh pending ratio.
Your pending ratio is the number of properties that are under contract relative to the number of inventory that's available. So, hypothetically speaking, if you are looking at a given area and it's got two properties that are pending and there are eight properties that are active, you take the 2 + 8 = 10. 2 divided by 10 is 20. You have a 20% pending ratio. So basically one out of five properties that come to market will sell in a given month, right?
So kind of gives you an idea of how long it's going to take to sell everything as well. Kind of like months of inventory, but it's a different way of looking at it. And they're not always in lock step. They vary. And we're going to look at this data here and kind of look at some Honestly, this is sc it's a little scary when you look at it this way. So, okay.
So, I mentioned balance is 18 to 25%. So, I've got the shaded area here that shows you this. In 2023, most of the market was had a very, very healthy pending ratio, but we were also in a very strong sellers market, right? So, you had pending ratios throughout the year. You see what I mean about eb and flow? When you're in the spring market, there's more stuff happening and it always trends up and then as you get towards the end of summer into fall into the dead of winter, it trends down.
cyclical, but in 2023 it was much higher. Uh this past year it was lower than the year before in 2024. Um quite a bit lower. So we finished in December of 2023 at 23% pending ratio which is right there in balance. In 2024 at 18% it was right at that cusp and now this year it was at 12.8%. So that is not a very strong pending ratio. shows that a lot of metro Atlanta has trended towards a buyers market even though months of inventory might show a different story.
So that's kind of why it's important to pay attention to a couple of these ratios. Now this is hyper local but this is for metro as a whole. We're going to break this down here and you'll see what I mean. So when we take a look at the different property types now single family finished at 13%. So, we saw what it was for overall at um roughly 12.8%. Right? So, single family 13.7%.
My apologies. Town homes were 12.9 and condos 7.6. So, if you're in downtown for example, Midtown downtown, you have a lot of condos. You're going to have a lot of competition. There's not a lot of them going under contract right now. It's going to take a while. uh one out of what is that roughly one out of 14 uh properties that come to market will go under contract in a given month.
So if you're if you've got a condo and you're looking around at your neighbors and somebody goes under contract and it's not you, I'm going to show you some data here for price cuts in a moment, but maybe you're not price cutting enough. You're not priced where you need to be.
Days on market and supply 20:10
Um it's definitely a market that you have to get ahead of the market in terms of pricing. If you price it to test the market, aka you price it a little bit higher than you think it should be, you you might as well not list at this point because you're going to just sit on the market. The market is not going to reward overpriced properties. You might not even get showings at this point.
If you do get showings, you're not going to get offers. So, you have to be priced at fair market value, preferably a little bit below, in order to attract that attention and have your property sell. Now again, there are exceptions to every rule. I will show you in a couple of slides some zip codes where you put your property on the market. Not only are you getting showings, not only are you getting offers, but looks like you're getting multiple offers and you're selling on average for a little bit above.
Uh so kind of um kind of interesting. When I found this data, it was like, wow, can't believe this is happening in the market. Because overall, the story tells the market tells a different story, right? So now let's take a look at how it breaks down by county. And the first number that just screams at me is Fake County. Now this is broken down by year. It's everything. So it's not just the property types separated, right?
This is everything. 7% in Fate County. Let's be honest, there aren't a bunch of condos in Fate County. So this 7% is pre primarily driven by single family housing. That's what's happening here. But that 7% is one of the lowest. It is the lowest on this entire list. Not by a little bit, by quite a bit. Right. So, any surprises on here? Let me know what your thoughts are in the comments.
Okay, let's get into how long it's taking properties to sell at the median at the half of the market. So, condos are taking 53 days to sell right now. Town homes 42. Overall, the market's at 32 and single family is at 28. We go back a year ago. Year ago in December, it was 31. So 31 up to 53. That's a big jump up in the days it takes to sell a condo.
Town homes 28 to 42. That's a big jump up as well. And then single family 20 to 28. So it's taking just a tad over a week longer to sell a single family home. Right? So, all of these are trending that are all trending at slightly different rates. Condos, it'll be interesting to see where the condo market goes over the next couple of months. That's for sure. Uh, but that's a lot of days on market.
Now, when you break it down by county, single family is blue, right? Black are the town homes and the gold are the condos. You can see what it is for metro Atlanta as a whole. And then, for instance, over in uh Fulton, condos are taking 57 days. So, it's the highest number of days uh for condos. Well, that's in Fulton. Now, single family is moving very very well if you're in Cobb County.
So, 21 days is the median number of days. Can it take longer? Absolutely. This is the middle of the market right here in Cobb. Uh DeKalb 28, Gwinnett 28. Those are also moving relatively quickly as well. And then after that where it's not moving quite as quickly and you're above that average is, you know, take a look at places like Douglas 41, Paulding 40, Rockdale 41. So some of the um outskirt uh counties, right?
Uh those are taking a little bit longer to sell houses. So uh Clayton County 35 days.
Supply levels by county 23:44
So moving on, we're now going to look at months of supply. I mentioned my thoughts on months of supply briefly when we talked about the pending ratio, but you can see here the shaded area is the balance market. The red dotted line is the line that after you cross over, well, you're in buyers market territory officially according to uh the standard. So, condos have been there for a while. So, they crossed over from balance into a buyer market this past summer and it's been trending up ever since.
So, we're at 6.9 months of inventory. And months of inventory means that if no new homes hit the market in these specific areas, it would take this number of months to liquidate and sell everything. That's what that means. So, 6.9 months of inventory for condos. Town homes have been trending towards balance, and I think that we're going to see this continue. Even if we have a phenomenal spring market, I expect town homes will be in balance by March, April.
So, uh, you take a look last year and it didn't stop like January. Uh, oh, uh, you take a look here. So, January, we started the year at 3.4 and every single month, spring market or not, it just trended up and up and up, right? So, single family was the same thing, but single family was at 3.8. You can kind of see here that in Q4 it kind of stabilized. It didn't trend up as the market slowed down this fall.
Single families didn't. Just kind of stayed kind of strong actually. So, um it'll be interesting to see where single family goes over the next couple of months. Uh but as usual, it's going to be less than town homes and condos. Okay, moving on. If we break this down by county, uh take a look at town homes over in DeKalb. So over in DeKalb, we are in balance market territory. Town homes in many counties have reached balance.
So Cherokee, Balance, Clayton, Balance. I mentioned DeKalb. Uh in Fayette, it's in a buyer market territory. Not a ton of town homes, but the ones that do exist in Fayette, they're over in buyers market territory. And then Rockdale also not a ton of town homes right now, but still um I mean that's almost buyers market territory at 5.8. Right. Single family where single family is doing really strong. It kind of echoes the median days on market.
And so we saw the lowest days on market in Cobb. Well, the lowest months of inventory are also uh that all that title also belongs to Cobb County. So 3.5 in Gwinnett and then when you take a place, you know, look at uh Fulton 4.4 4.1 in Forsyth and four over in DeKalb 3.4 in Cherokee.
Showing activity and interest 26:33
Things are moving there as well. So showings okay if you take this is where showings ended for the month of December. This is the number of showings in that given month. It's not showings for the whole year. Now in December of 2020 and 2021 there were 56 roughly 57,000 showings and over the last couple years that dipped to 43 41 almost 42 and uh 45,000 showings. This year we're up to 57 almost 58,000 showings.
So we're back to where we were during the height of the health crisis, right? 2020 and 2021. But here's the main difference. Take a look at the pendings. So back then, the pendings for both 20 and 2021 were roughly 7,000 in the month of December. This year, we're down to 2,300. That's three times less properties that went under contract in spite of having the same number of showings as we did back then.
Interesting, right? So number of activives are significantly higher too. Here you had 8,500 activives and 6,500 active properties to choose from. So much less it's basically a 1:1 ratio for if you were you had for every property that was active, you had one that was going under contract. Now, this is like an 8:1 ratio. For every active, you have one going under contract. Uh, so it's even less when you factor in that pending ratio, which is the 12.8%.
So, interesting uh that people are out looking at houses, they're just not buying them right now. So, moving on, we're going to take a look at how this breaks down by county. And you can see this is going to be showings per listing by county. So, if a county has a ton of um active properties to see, there's still only a finite number of showings and it's breaking down by the number of listings.
So, it's normal to see that in 2023, we talked about how there were less uh there was less inventory, right? There was 8,500 in uh 23 and then um 6,500 active listings in 24, for instance. And um now we have quite a bit more. So as you have more active listings, it's less showings per listing. Even though showings are roughly the up, you know, they're up year-over-year from 45,000 up to 57,000.
So that's when you take a look at this, take it take a look at it with a grain of salt. But right now, um in metro Atlanta, listings are getting an average of 3.7 showings on average. So, if you're on the market and you have, let's say you're over in Cobb and you've had nine showings but no offers, well, the average listing in Cobb is getting 4.5 showing. So, if you're getting more than the average and you're not getting offers, market's probably telling you that you're overpriced.
That's exactly what that means. uh if you have um you know less than that um if the average is 4.5 and let's say you've only had the one showing the market is also telling you that you're overpriced both kind of say the same thing from different perspectives if that makes sense right so let's move on and take a look at the showings per listing by type so obviously single family gets more attention than town homes homes and condos, there are more people out looking for single family.
Price cuts and negotiations 29:53
So that's why you're going to see these numbers almost double everything else. So here we're going to talk about price cuts. I've got two slides coming up. I've got this one here. This is active inventory. And we're going to look at pending inventory here in a moment. We're going to compare the two. So 41% of all the active properties in the month of December had one or more price cuts across metro Atlanta.
And when they had a price cut, they had an average of 5.8% is what they cut by. Okay, that's what the red is relative to the black. So in places like for example in Fulton, it's going to be very close to the overall, but roughly 40% have cut by an average of 6.6. So think of it this way. It's of those that have had a price reduction, they've cut by this amount because we have obviously 60% of the listings in Fulton haven't had a price reduction.
So, they haven't had price cuts. So, that's how this calculation is done. So, if you take a look at the cap for instance, 44% of these listings have had cuts of an average of 7.4%. And that is really, really high. Where we haven't had cuts quite as high, uh, Cobb County, 4.8%. But there's a reason for that because they're selling, right? So 28 21 days was the median and you had three months of inventory which is a lot faster than the rest of the market.
So it's a hotter market. So you're not necessarily needing as many cuts to be able to sell. But let's see how that actually compares. So 42.2 to 4.8. What about the ones that went under contract? So the ones that went under contract, uh, 46.5 and 6%. So roughly those that are under contract needed to cut by 1.2% more on average in order to attract that offer. So we saw earlier uh with uh DECAP, for example, 44% of the listings had cuts of 7.4, but the ones that are under contract needed to get cut by an extra 1%.
So they needed to be at 8.4% on average to attract that buyer and go under contract. So Fulton 8.1% from 6.6. So that's an extra 1.5% above and beyond where you currently are if you're sitting on the market without an offer as an active listing in Fulton right now. While those that are going under contract have had an average of 8.1%. So kind of gives you an idea, but it's hard to conceptualize percentages, right?
Because it depends on your average prices. So let's take a look at actual dollar amounts.
Dollar impacts on listings 32:46
That's what's coming up right now. So, this is a great chart to look at counties averages versus active and pendings. So, for example, we were just talking about Fulton. So, Fulton average uh property that has had a reduction has had a reduction of 40,000, but they needed 49,000 on average in order to go under contract. That's the way you want to look at this. So, if you're on the market, you're above the median days, you're you're not getting the showings that you need, and you may have had price cuts.
Fortunately, you may not have had enough price cuts in order to get there. So, some people at this time of the year have said, "Look, we're not going to keep cutting our price. It it's a slow season. Let's just take the house off the market." which is why you see the number of active inventory drop from almost 21,000 listings in October down to 15,000 in December. Right? At some point, you get fed up.
You're going to take a break for the holidays and you're going to reset and recalibrate and go back potentially at a higher price, potentially at a better price, maybe even the same price uh in the market uh in the spring market. Maybe you take the feedback that you got over the course of uh Q4 with all the showings that you had and if people there's a theme there, people keep bragging on something on your house, maybe you get that thing addressed, right?
If it's raggedy old carpet that needs to be stretched, well, maybe you don't stretch it, maybe you just replace it. You know, if it's if the carpet's immaculate and just needs to be stretched, maybe you just stretch it. Um, depends on what the feedback is. But it's important for you to have an open dialogue with your agent. It's important to know when you're when you have a showing, not just whether or not somebody like the house, like honestly, who cares if they like the house.
More more importantly is are they going to make an offer? Because if they're going to make an offer, obviously they like the house, but if they're not going to make an offer, your agent should be asking the other agent why not. And then you find out exactly why. And if it's something that's within your control to potentially address, now you could potentially make a reverse offer. And that's where you go back to the buyer's agent.
You say, "Hey, look, we know that your client was hesitant about our property because of X, Y, and Z. If we handle that for them and build it into the price, for example, or here's how we propose to move forward while handling those objections, could we potentially get to contract?" And in some cases, you know, you won't get the buyer to to budge on it. There there's enough properties out there that they might be looking for a property that's just ready to go.
But in some cases, a buyer would love your house. They don't think because of where the market was over the last couple years that you're going to want to do any repairs or address anything, so they just move on. So, it's kind of eye opening when you're a buyer to receive a reverse offer where it's like, "Oh, wow. They actually would take care of that." You know, I'm working with a couple right now where we saw a house this past weekend where the front porch seems to be coming off of the property.
Like there is there's a huge structural issue with that. The foundation and the house itself seem fine. Uh but the front porch, the right side is just sinking. Erosion or something underneath created gap and the the weight of it is just pulling it off. So it's pulling it off the house. Not a good situation. But after talking to the agents, they know that whether we buy the house or not, they're going to have to fix it for somebody.
So, they're out getting quotes to fix it now. And for my clients, they were very uh open-minded to the fact that they that that was going to get fixed. You know, whether or not they buy the house, I don't know. We've got more properties that we got to see. But as a seller, use that as a benefit, right? Like, you might be able to get a buyer off the fence. At the very least, it opens up a dialogue to see if there's a way of finding a win-win with this.
So, if you're on the market, you know, and you're pulling the property off because you don't want to deal with more price reductions and you just want to let your property breathe right now, that's not a bad strategy. A lot of people are doing that.
List to sales performance 36:56
They're going to come back to market in the spring. This is a great chart to show you if you're on the market and not getting the results you want. Well, those who are getting the results, this is kind of what they've had to reduce by to get there. Okay. So, list to sales ratio by type. Um, is it any wonder that condos are selling at a 5.4% discount? No. I mean, huge buyer market.
Uh, there's a lot of condos. There's way too many of them on the market to choose from as a buyer. So, you can afford to be extremely aggressive with your offers. And if one condo doesn't take it, eventually you'll find somebody who will. because if they don't, I mean, right now that pending ratio is at 7.9%. It's practically one out of 14. Uh there's a lot of competition that's just going to sit on the market.
So, if you want to move, you might as well get a deal done. As a buyer, if you want a condo, it's great time to be shopping for one. Okay. Single family, uh roughly 96% overall market was like right there as well. Town homes 96.3%. Okay. So, did sellers get their price? And this is where we're going to look at some interesting stuff. I'm going to show you here on the next slide where some of these hot pockets are.
Uh because 73.4% of all properties that sold in the month of December did not get their price. They sold for under their asking price. 17% 17.5 sold at the asking and 9.1% sold above asking. Right? And you can see how under list prices trending up at or above are trending down year-over-year. So keep that in mind. 9.1% because I did mention that I found some areas where they're like 20, 30, potentially even 40% of the listings in these given areas are selling for above.
So what areas am I talking about? Well, let's take a look at that. If it loads, here we go. Here are my hot pockets. So these are the different zips. And the first two, these are not anomalies. These are not outliers because I've looked at a sample size of at least 10 listings to see this is what's closed in a given month in in the month of December. Okay. So, for example, 30168, there were 13 closings.
Six of the 13, almost half, 46% sold for an average of 3.2% above the asking price. That's a next zip. 30106. 14 properties closed. Six of them uh sold for above asking almost 43% for 4.1% above the original asking price.
Hot pocket zip codes 39:35
That's also a what's happening with hostel. Do they like there's there's something going on in order for all of this to be concentrated in that area? I don't know. I I might have to do a deep dive to see what's happening. I didn't have a chance to deep dive that. If you know of something that's happening in Austell right now, let everyone know in the comments or if you want to guess as to what's happening.
But that is crazy, right? That's 43 and 46% of all the properties that closed in that month sold for more than asking in a market where 9.1% of properties are selling for above asking. That's a huge huge anomaly. So 30030 is Decatur 22 closings, nine properties sold above asking for 2.8%. 30134 that's Douglasville. 30060 is a part of Marietta that's close to the square for instance. 23, 9 properties sold for above for 2.3%.
30092 that's you know Peachtree Corners Norcross 18 and seven for 2.6% more. 30331 is um South Fulton and South Fulton 23, 8 properties sold for above. 30047 is Lilburn. So a third of the properties this is Roswell 30076 and then 30013 is Conyers. Surprising, right? So that's what I love about real estate as a whole. You look at if you listen to what's happening in the news, real estate as a whole in the country is, you know, not trending where you want it to go.
There are all these problems. And then you look at different cities. In the Southeast over the last decade, it's been gravy. It's been awesome here. Now, we're starting to see the market correct a little bit. Meanwhile, in the Northeast, it's on fire. But even within our region here in Atlanta, you definitely have some hot pockets that are outperforming the rest of the market. So, I thought that was very interesting. Let me know what you think in the comments.
Closing costs and outlook 41:42
Moving on, uh, year-over-year, there's been an increase in the number of sellers paying closing costs, which is great. You're going to have to contribute somehow if you want to compete with new construction. So, there are more sellers paying closing costs. You're now over 23 of all sellers who agreed to pay closing costs. And then they're paying almost 9,000 on average. Now, uh that's up from 8,600 uh this time last year in December.
So, that's it's not a small number of money because if this is the average, you know that some contributed quite a bit more and of course there are some who contributed nothing. If it's in these areas where these properties, so that's the other thing too, the uh the previous slide where I was talking about the hot pockets, right? Selling for above asking. Sometimes a property will sell for the asking price, but the buyer in order to buy that house needs the closing cost.
And it's not unreasonable to think that they kept the price at the asking price and just or or rather they they wanted to keep the net at the asking price and they took the 10,000 in closing cost and instead of selling the house for 500, they sold it for 510. Right? So it looks like it goes above. So that's something that on a deep dive to look at how many times did that happen?
how many multiple how many properties that sold above asking also had closing costs cuz then it's just building it into the price. It's a wash for the seller, but you still have to be in a competitive area in order for that price to go up, right? So, it's um it's something that I'm going to take a closer look at in this next month's upcoming video. Let's do it that way. So, stay tuned over the next couple of days and weeks.
I've got the luxury stats video that's going to come out. I'm going to do a predictions video with my thoughts on where I think the market's going to head. We're going to get very granular with that one. Um, should you buy a house in 2026? Going to talk about that as well. And if you're going to watch more videos today, well, in the meantime, YouTube thinks you should watch this one next.
Thank you so much for watching and I hope to see you on the next one.

About Terence Richardson
Terence Richardson is a Realtor with Compass and the founder of the Terence Richardson Group, which serves Metro Atlanta. He publishes Atlanta’s Housing Market Update every month on YouTube and in The Richardson Report.
