Pick a county on the map
Market data
What the Atlanta housing market is doing, in plain English.
New numbers every month for Metro Atlanta and its 12 core counties, for houses, townhouses and condos. Each one comes with what it means if you're buying and what it means if you're selling.
October 2026
Who has the upper hand right now?
Metro Atlanta
It's mixed.
There aren't many homes for sale, which helps sellers. Homes are slow to go under contract, which helps buyers.
How much is for sale?
3.9 months
Sellers' side
At the current pace, it would take 3.9 months to sell every home for sale across Metro Atlanta.
How fast are homes going under contract?
15 of 100
Buyers' side
Of every 100 homes for sale across Metro Atlanta, 15 went under contract in October. A year ago it was 23.
The two lines are how Terence reads the market in his monthly update: under 5 months of homes for sale and more than 25 of every 100 going under contract favors sellers; over 6 months and fewer than 18 of every 100 favors buyers. Months of supply is measured over the last 12 months. Source: GAMLS InfoSparks.
Four numbers that matter
What that means for your money.
What are homes selling for?
$422,000
is the typical sale price over the last 12 months.
About the same as a year ago ($420,000).
- Buying
- Prices have held still for a year.
- Selling
- The market isn't raising your price for you.
How long do they take to sell?
50 days
That's about 7 weeks on the market.
1 day longer than a year ago (49 days).
- Buying
- You usually have time for a second look.
- Selling
- Plan on about 7 weeks, not a weekend.
How close to the asking price do they sell?
98.2%
of the asking price is what the average home sold for over the last 12 months.
On a $422,000 home, that's about $7,600 under the asking price.
- Buying
- Most sellers come down a little. Offer with that in mind.
- Selling
- Expect to give up about $7,600 on a typical home.
How many homes are for sale?
16,669
single-family homes were for sale in October.
7% more than a year ago (15,588).
- Buying
- You have more to choose from than a year ago.
- Selling
- You have more competition than a year ago.
The long view
Home prices across Metro Atlanta, 2013 to 2026
The typical single-family home across Metro Atlanta sold for $115,000 in the 12 months ending January 2013 and $422,000 in the 12 months ending October 2026.
County by county
All 12 counties, side by side.
Pick a county name and the whole page switches to it. The table follows the type of home chosen at the top of the page.
| Area | Typical sale price | Days to sell | Share of asking price | Months of homes for sale | Homes for sale | Sold in October |
|---|---|---|---|---|---|---|
| $422,000 | 50 | 98.2% | 3.9 | 16,669 | 3,069 | |
| $499,500 | 47 | 98.3% | 3.7 | 1,223 | 236 | |
| $247,000 | 54 | 97.6% | 4.2 | 751 | 154 | |
| $470,000 | 42 | 98.3% | 3 | 1,972 | 448 | |
| $367,000 | 50 | 98.4% | 3.5 | 1,926 | 387 | |
| $320,000 | 59 | 98.1% | 4.7 | 638 | 115 | |
| $530,000 | 48 | 97.9% | 4.4 | 556 | 100 | |
| $634,900 | 49 | 97.7% | 4 | 1,037 | 158 | |
| $530,000 | 52 | 97.9% | 4.3 | 3,020 | 530 | |
| $427,000 | 48 | 98.2% | 3.7 | 2,760 | 510 | |
| $347,000 | 58 | 98.4% | 4.7 | 1,350 | 237 | |
| $359,990 | 55 | 98.7% | 4.2 | 947 | 161 | |
| $325,000 | 56 | 98.1% | 5.1 | 420 | 61 |
Full report for each county: Cobb, Fulton, DeKalb, Gwinnett, Cherokee, Forsyth, Paulding, Douglas, Henry, Clayton, Fayette, Rockdale. Also: the monthly slide decks and how these numbers are made.
Single-family homes, October 2026. Price, days, share of asking price and months for sale are measured over the last 12 months. For sale and sold are counts for October. A county is reported once at least 100 homes sold there in 12 months. Source: GAMLS InfoSparks.
The monthly video
Rather watch than read?
Every month Terence walks through these numbers on YouTube: prices, how much is for sale, how fast it's selling, and what it means if you're buying or selling. The newest update plays first.
See every monthly update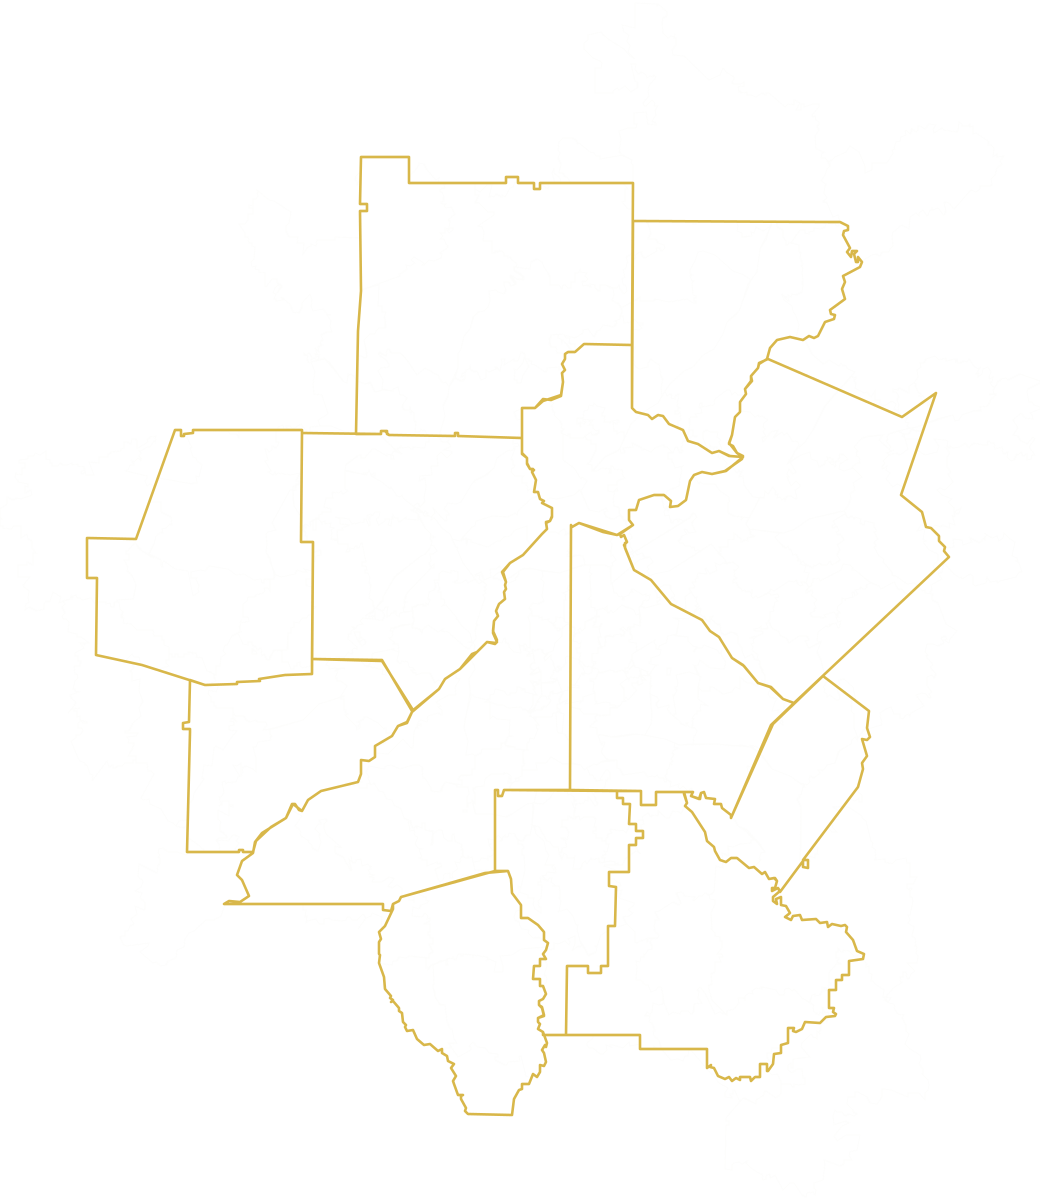
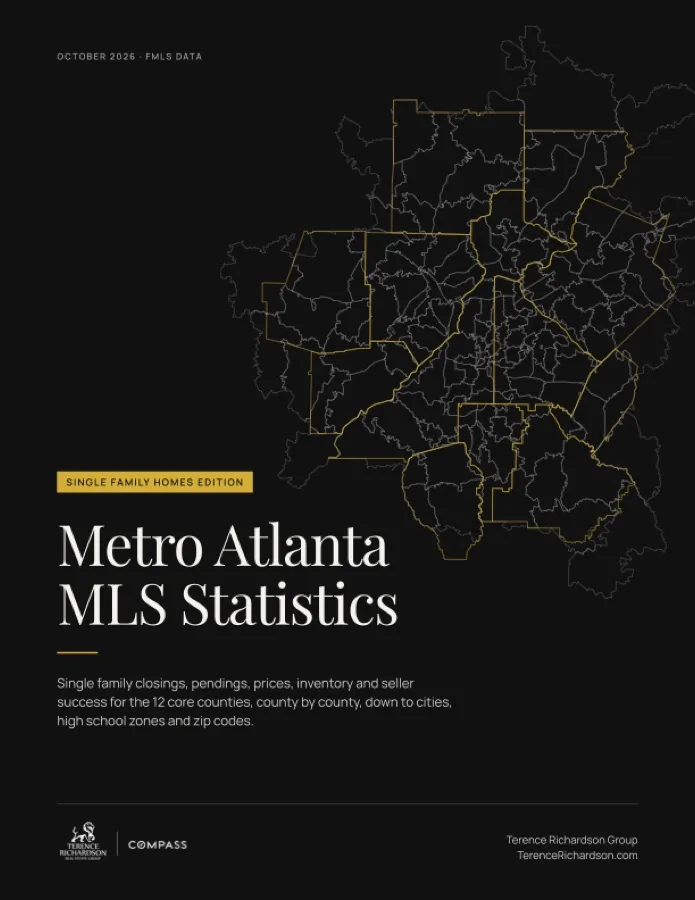
Want it down to your zip code?
The Metro Atlanta stats book
County by county, down to cities, high school zones and zip codes. It comes free as a PDF when you sign up for The Richardson Report, which goes out two to four times a month.
Questions people ask
About these numbers.
What is the median home price in Metro Atlanta?
The median sale price of a single-family home in the 12 core counties of Metro Atlanta was $422,000 over the 12 months ending October 2026, according to GAMLS InfoSparks. A year earlier it was $420,000.
What is the median price of a townhouse or a condo in Metro Atlanta?
The median sale price of a townhouse in the 12 core counties of Metro Atlanta was $363,758 over the 12 months ending October 2026, and the median sale price of a condo was $285,690, according to GAMLS InfoSparks. A year earlier the figures were $370,000 and $290,000.
Is Metro Atlanta a buyer's market or a seller's market?
As of October 2026, Metro Atlanta had 3.9 months of single-family homes for sale, and 15 of every 100 homes for sale went under contract that month. By the measure Terence Richardson uses in his monthly market update, the first figure favors sellers when it is under 5 and the second is balanced between 18 and 25. Source: GAMLS InfoSparks.
How long does it take to sell a house in Metro Atlanta?
Single-family homes in Metro Atlanta spent 50 days on the market over the 12 months ending October 2026, by the days-on-market measure GAMLS InfoSparks reports. A year earlier the figure was 49 days.
Which counties does this page cover?
The 12 core counties of Metro Atlanta: Cherokee, Clayton, Cobb, DeKalb, Douglas, Fayette, Forsyth, Fulton, Gwinnett, Henry, Paulding and Rockdale.
Where do these numbers come from, and how often are they updated?
Every figure on this page comes from GAMLS InfoSparks, the statistics service of Georgia MLS, and covers single-family homes, townhouses and condos, each reported on its own. The Terence Richardson Group updates the page once a month. A county is reported for a type of home once at least 100 of that type have sold there in the trailing 12 months. Sale price, days on the market, share of asking price and months of homes for sale are measured over the trailing 12 months. Homes for sale, homes sold and homes under contract are monthly counts. "Typical" means the median. Share of asking price compares the sale price with the asking price at the time of sale.
Book a discovery call
Want to know what these numbers mean for your house?
A county average only gets you so far. On a discovery call, Terence talks through your street, your price range and your timing. If now isn't the time, he'll tell you.