Plays here from YouTube when you press play. Open on YouTube
Published . Prices, rates and counts in this video were current on that date. This month's numbers are on Market Data.
What is this video about?
“Atlanta's Housing Market Update (October 2025)” is a 37-minute video by Terence Richardson, a Realtor with Compass in Metro Atlanta. It was published on October 4, 2025 on his YouTube channel, Terence Richardson - Atlanta Real Estate.
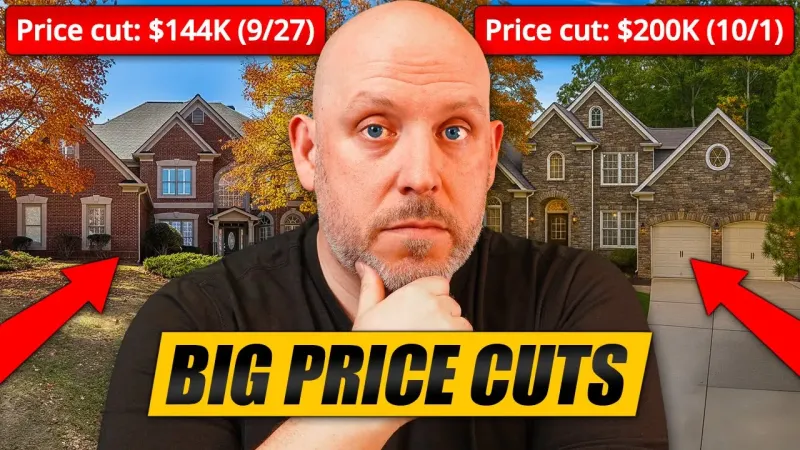
We're seeing some of the biggest price reductions across all eleven counties that make up the greater Atlanta area. Atlanta real estate prices are falling. Good news for buyers or is it too soon? What about for home sellers? Should they panic yet? Tune in to find that out and more in this month's edition of Atlanta's Housing Market Update.
Transcript
This is the caption file published with the video, set into paragraphs. Place names the captions misspelled were corrected. Nothing else was added or reworded. Captions can still mishear a word or a number, so check a figure against the video before you rely on it. Captions read November 16, 2026.
Atlanta's Housing Market Update - October 2025 0:00
It's October and the Atlanta real estate market is experiencing some of the biggest price reductions we've seen on active inventory in quite some time. That and so much more coming up in October's Atlanta housing market update. Let's jump right into it. But I've got to tell you, I'm pretty excited about this month's video because for the last I've been making these videos since June. And every time that I make a video, I come on and I say, you know what, the median price is 425.
The median price finally moves... 0:26
That's 425,000. Stuck at 425. We're always at 425.4. 425. It's been 425 since September of last year. Every single month for the greater Atlanta area. Those are the 11 counties that make up greater Atlanta that I talk about in every single video. You'll see them here in just a moment. Now, for the first time in over a year, we have something different than 425. But what are we looking at? Take a look at this.
This is brand new, my friends. We now have a median price of 424,990. That's not 425. It's 10 bucks short. But is this the sign that that 425 line that we've seen for the last year is finally breaking? Are we going to see the prices actually the median price actually start to come down in these next couple of months? And I actually think that we are. I mean, we're going to unpack all of this here, but all the indicators are showing that it's going to start trending down.
Average price update and by-county overview 1:20
Now, average price 531 241. That's down ever so slightly. Let's see how this is all broken down. So, I'm going to show you by county. I'm going to show you a much more interesting chart than this in just a moment, but I wanted you to get a feel when you look at it this way. You can kind of see how the counties compare to each other, right? And as a reminder, I'm I'm focusing predominantly on the 11 counties in this video.
Think of it more as a bird's eyee view. If you want more specific, you're going to want to tune in to the North Atlanta video, the ITP video in town, and also the luxury video because we get very specific. We look at cities, zips, and neighborhoods. Okay? So bird bird's eye view obviously Forsyth County up uh year-over-year. In the luxury video, we talked about prices coming down because they've definitely overbuilt in that segment of the market, but Forsyth overall is trending up year-over-year.
When you're taking a look at it this way, Forsyth County is up 2.7% year-over-year. Cherokee County is up, Paulding's up just a little bit, Douglas and Fayette. Everything else is down with the exception of Cobb. So Cobb stands still at 435. Fulton's down 0.1. That's negligible, right? Some of the biggest drops though are on the south side of the city. So when you take a look at Rockdale County for instance, southeast, right?
You're looking at Conyers down 6.2%. So DeKalb in town 365 and Gwinnett's down ever so slightly.
Inventory overview, actives vs pendings vs closings 2:45
So let's take a look at inventory. And we're starting with basically everything on one chart so you can kind of see how it stacks up. And this is for the last year. So activives obviously you'll have more activives than pendings, closings, withdrawns, expireds, etc. It's just how it goes. Uh but we had hit a peak here and uh there's slightly less. The reason why is when you take a look at these failed listings, you see that they're trending up, right?
See that red line? So as homeowners get tired of being on the market, we're going to talk about that in this video. If you're a homeowner, you cannot afford to test the market right now. market is testing you and they're testing you based on how you price your house. So, right now there are a lot of homeowners who've decided that you know what, we're going to wait until springtime. We're going to start pulling our properties off of the market.
As that happens, active inventory goes down, new goes down a little bit as well. You're seeing it kind of pat here, uh, stand still. And what that is, it's less of the houses being relisted after they're withdrawn. So, they're staying off the market until usually springtime at this point. So when you're seeing that, you're also seeing that the closings are down and pendings are down. So that explains why overall active inventory is down.
But this is going to create some interesting opportunities.
New listings and seasonality window 4:00
So next slide, we're going to look at specifics. So this is new listings coming to market and you're starting to see that we're heading into that seasonality that we've had in every other well the last two years anyways. When you look at these different colors here with the amount of new properties coming to market, it's normal. We're heading into fall. Between now and Thanksgiving, you have a window of opportunity. There's going to be quite a few buyers out in the marketplace.
Then things slow down considerably between Thanksgiving and the new year for the holidays. That's not to say that you still can't sell a house. As a matter of fact, you're on the market at that time. If you're getting showings, they're usually higher quality showings because if you're looking for a house at that time of the year, you're generally very motivated. So, you're very serious about the process. Uh, so they're good quality showings.
It's just that there's going to be a lot less of them. So, this is new. And then when we take a look at the next chart, we're looking at active inventory.
Active inventory trend heading into fall 4:52
So, how it compares over the last couple of years, we're seeing a downward trend here. In the previous years through the fall, there was still appreciating inventory. So, that's starting to change. I think it's just in previous years, you put the house on the market and you test the price, you can get it. you'd be more sellers were motivated to sell their properties and or keeping them on the market longer because it was a stronger sellers market.
The tides are shifting, right? So, as homes exit the market, and we'll take a look at that with the uh failed chart here in just a bit, it's normal that the amount of homes available for sale come down. So, that's more in line with historical averages, not the two to four years period that we just got through.
Pendings down, 12-month outlook setup 5:38
That's really an anomaly. So pendings are down. This is down considerably compared to these last couple years as you can see. And that's why I think as we start to move into these next 12 months, I it wouldn't surprise me when I do this update in October of 2026 to have seen our median price come down by I don't know about quite a bit, but definitely come down. So unless something happens in the marketplace that would cause that to uh you know make a U-turn like for example interest rates coming down I think that's the course that we're on.
So let's see here.
Closings flat vs last month 6:15
So closings uh have been relatively flat. It was like 5,300 or 30 3500 last month. It's 3516 thereabouts this month. So it's relatively flat. Uh but you can kind of see where that is. We're underperforming relative to the last year. And moving on, here are the failures.
Failed listings rising (withdrawn and expired) 6:34
So, I've mentioned this in previous videos. If you're a first-time viewer, when you see this upswing at the end of the year, that's because every agent and their mother will have a listing end on the 31st of December. So, there's a disproportionate number of listings that fail that expire on the last day of the year, then they come back to market. So, we're probably going to see something like that with an upswing towards the end at the end of the year.
Uh, it's going to follow that as well. But failures with our which are our withdraws and expireds are ahead of last year. So, what in order to get this under control, when homes go to market, they have to be more appropriately priced for that specific market based on location, price, and uh condition. So, moving on, here is that chart that I've been using over the last little while.
Actives to closings gap tightens slightly 7:26
So, this is active to closings. The gap here actually got a little bit smaller this year, uh, this month. So, we were trending towards a much different outcome these past couple of months. And the ratio just tightened up a little bit. So, um, we're not heading over a cliff tomorrow, but we're still trending that way. All right, moving on.
Pending ratio by county, where demand is strongest 7:49
pending ratio by county. So, uh this is one of the more telling charts uh when we're taking a look at what's happening in the market. The pending ratio is the number of properties that go under contract relative to the active homes for sale and the pendings added together. So, ultimately, when you take a look at Atlanta, it's 13%. Which is roughly one out of every 7.69% of homes. So, one between one house goes under contract for every seven to eight houses on the market.
So, if you're you're in a given area and there are eight houses on the market, only one of those houses is going to go under contract per month, basically. So, you're looking at your neighbors and your neighbors are looking at you and you're wondering who's going to go under contract. Well, this is a theme that's going to repeat. It's whoever looks the most attractive to the market. Put yourself as a home seller in the shoes of a buyer.
If you have all this choice, what's going to help separate you from your competition? So, you've got to be in tip-top condition or at least better condition or at least if you're not priced appropriately so you're perceived to be of value in the marketplace. It's just how things are right now. So, you can see it's a big drop from last year. The black line is last year, the gold line is this year.
And there's really only a couple places where it's above that average. and you're looking at Gwinnett, uh, Paulding, some Douglas, some Cobb, you know. So, ultimately, uh, it's a market that is quickly quickly shifting and there are less houses going under contract relative to inventory. We're going to revisit this stat, uh, towards the end of the video when we look at affordability because it makes a big difference as well.
Days on market by county 9:29
Moving on, cumulative days on market. So, we're at 56 days right now and you have some counties that have transitioned over that. Uh, so look at Gwinnett. 69 days on average to sell a house right now. This is everything. So this is houses, town homes, condos, everything together. So 69 days on average. Douglas is pretty high at 65 days. Clayton, Fayette. So you see a lot of the southside counties are struggling.
Uh, in town, Fulton, big county. Uh, Forsyth is under, Cobb is under. So 49 days in Cobb on average.
Months of supply, more counties at balanced levels 10:05
Moving on, we're going to take a look at months of supply. Now, months of supply tells us what kind of a market we're in. This buffer zone here is a balance market. That's five to six months of inventory. As a whole in Atlanta, we're at four months of inventory. When you break this down by property type, it shifts. Of course, uh single family homes a little bit under this. Town homes and condos are above.
But when you take a look at the overall market, you can see here that Fayette year-over-year, that's a big jump up. jumped from a sellers market here 3.9 months into a balanced market. Uh when you take a look at Fulton, it's touching that now. It's crusting it right at five months of inventory. So Fulton's also in a balanced market. Take a look at Gwinnett. It's also in a balanced market. So this time next year, I expect that more of these counties, if not most of them, will be in a balanced market.
And it wouldn't surprise me if some of these ones that are in balance markets this year are firmly in buyer market territory this time next year. So what this really means is that the tides continue to turn in favor of the home buyer.
Buyer leverage rising, price cuts and concessions teaser 11:11
So we're going to talk about tactics and strategies throughout the video, but things are getting better and better for buyers. You're going to see the types of price reductions which are crazy. some of the biggest discounts I've seen on active inventory in years right now. Uh more concessions are being paid and there are more sellers paying them. So, it's um really honestly the only thing holding a buyer back right now could be interest rates and those eventually hopefully will come down.
Like theoretically at some point they will come down, right?
Showings by price range 11:43
Question is when. Uh moving on, showings by price range. Let's look at showing activity because you'll see here that it's uh two years ago in most of these different brackets there was more showing activity uh and then there was a big dip last year and now buyers have come back and forth to look at houses but not necessarily buy them. They're just they're not buyers don't feel that sense of urgency to rush out and make an offer on the first couple of houses that they see because they know that they're not going to lose out on these properties to other buyers because there's over 20,000 houses available for sale right now.
And only 3,071 of them went under contract uh this past period, this past 30 days. So when you're looking at that ratio, you have a lot of choice and you don't necessarily have to rush. So, if you don't have rush and you have a lot of choice, you're going to want to see more houses. And this is how it breaks down by county.
Showings by county 12:38
So, it's the usual suspects that dominate showings. That's what's nice about this is it shows where attention is, right? Where buyers actually want to buy. And it's Cobb, it's DeKalb, it's Gwinnett, and it's Fulton. And then to a lesser extent, Forsyth, but there are less listings in Forsyth. Really, I should create a chart here that shows uh showings per active listing. I think I created that chart actually. It would give us a better idea of how the counties stack up when you have a big county like Fulton that goes up against a smaller county like you know aid for example or Paulding.
Showings per active listing (attention per listing) 13:12
Let's take a look at that. Okay. So this is the ratio of showings to activives. So in a given area if you have 100 showings and you have 40 listings then it's 100 into 40 and that's the ratio right 10 to 4. So here this is all to one. So the black line is the ratio last year and the red line is the ratio this year. So when you're taking a look, it's up.
So there are more showings happening in general everywhere. The biggest jump up is in Rockdale County where last year listings were attracting on average 1.9 showings per listing. Now they're at 3.1 and it's up practically everywhere. Really the only place that it's down marginally is in Fayette Fayette County. uh there's 0.1 less showings per per listing. And then over in Forsyth, it's the exact same thing. Now, this is interesting because it shows stability year-over-year.
Same ratio of showings per listings. But what about how many showings it takes for a property to go under contract?
Showings needed to go under contract, big jump year over year 14:14
That's a new chart. This is a new chart. So is that one. That one is very telling. Take a look at this. Okay, so this is crazy. This blew my mind. Um, when you're taking a look at how many showings on average it's taking for a listing to go under contract in these different counties, that's a big difference from the 4:1 5:1 ratio that we saw with activives. So, this is what this really means is that you really, again, it's going to come I feel like I'm going to be sounding like a broken record here when I'm talking about what sellers have to do, but it's a huge advantage for buyers because it puts a lot of pressures on sellers.
And if you're or a lot of pressure on seller pressures, I'm sure there are a lot of pressures, too. But when it comes to selling a home right now, when you're looking at this, you're getting a decent amount of showings per listing. I mean, it's not like it was a couple of years ago where you put a house in the market and you'll get 20 to 30 showings. Right now, you're lucky to get a handful of showings, but it's taking that many more multiples of showings to attract an offer.
So, for instance, in Cobb County, last year it averaged 17 showings for one deal to go under contract. Now, it's 25 almost 26 showings for one property to go under contract. That's a big big jump up. Look at it in Gwinnett. It's practically the same thing. 18 to 26. You know, Bay 8 and a half to 18.3. That's over a 100% increase in the number of showings it takes for property to go under contract.
as a whole in greater Atlanta, you're taking a look at 16 last year and almost 24 this year. You know, that's a what is that 50% increase in the number of showings to go under contract. So everything this is all evidence to support what I'm saying when it comes to just being extra diligent. It's not impossible to sell a house right now. It just comes down to pricing it right because I still all the houses that we've looked at with clients over the last week and all of the houses that you know you you see how they're priced, you still go and see them, but when you run numbers on them, you're like, gosh, this is so overpriced.
You know, there's a couple that we could have made offers on, but we decided not to because they weren't going to appraise. There's a lot of outofouch properties that are just priced way too high right now. So that's what's contributing to this. So heads up as a buyer, you know, you make sure that you know your numbers when you're looking at these houses and how they're priced because a lot of them, as you'll see, are overpriced.
But I I'm excited to get into the price cut data because I think that it's also also very telling.
Price cuts on active listings, metro overview 16:54
So here we've got price cuts. So all ranges throughout metro Atlanta, roughly, this is for active listings, not properties that have sold. So half of all of the active inventory has had one or more price cuts, price reductions, and an average when they have been reduced of 6%. So if you're on the market for 500,000, it's an average of $30,000 off the price of the house. Right now, the lower the bracket, the higher the reductions.
It's interesting how that works, but between 100 to 200, the average is 12%. That's a significant number when you start to look at where we are for median 520 425 no sorry 42490 10 bucks off but 425 it's right at the average right a little bit less 6% is the overall Atlanta average and it's 5% in that bracket but half of all the listings have had price reductions when you look at this no less than four out of 10 in some brackets And generally more towards half of these listings have had reductions.
And you can see that they're generally 4 to 5% off on average.
Price cuts by county, where discounts are largest 18:06
Now when we break it down by county, you can see here where some of the bigger discounts are. So for instance, over half of the properties in DeKalb have had cuts of at least 8%. That's significant, right? Taking a look at some other places, Forset County half, but 5%. uh bigger one. Keep having to put my head around this big mic. 46% in Fulton, 7%. 7%'s a big big drop. Same thing in Clayton.
So, properties, these haven't sold yet. They they and I I know what's coming chartwise, and we're going to It's Let me just show you because it's really fascinating, I think. Okay, so here are the pendings with cuts.
Pendings with cuts, how much sellers had to stretch 18:49
So the the chart that I just showed you by county are active listings. The pendings are the properties that actually went under contract, right? So think of it this way. So when you're looking at DAB, active listings had eight, but the ones that went under contract needed 10. So when you're taking a look at Cobb, for instance, in Cobb, average listing was cut by 5%, but in order to go under contract, they needed to get to 6%.
So, it's showing you that it's possible to sell, you're having to stretch a little bit more. And if you don't price right on the onset because again in Cobb, that's only 39%. So, that means that 61% of all the listings that were went to market in Cobb that went under contract were priced appropriately because they went under contract with a uh without needing a price reduction. Now, that's not to say that a lower price wasn't negotiated once they were under contract uh to go under contract, but that's what the MLS is showing between last active price before going under contract.
That's what that means. So, you can see that these numbers are a lot higher. You go back back and forth, it'll really illustrate it. So, it's generally 1 to 2% more. When you look at the back and forth, you know, take Fulton for example. 7% is what the typical active listing has had that has had a price cut. And then the the ones that have gone under contract, it's 2% more at 9%.
So, this is what that ratio looks like. And look at the gap in between. And I think it's really, really telling because it shows just how far you have to stretch if you're not priced right from the onset in order to attract a buyer and go under contract. I don't know about you, but when you take a look at DeKalb, it's crusting at 9.9% a 10% reduction. Put a house in the market for 500,000, that's 50 grand.
Million bucks, that's a h 100,000. That's not that's not play money. Like that's a lot of money for most people. So those are big big discounts. So now let's look at what sold properties have sold for relative to their original ask price.
List to sale ratio, average discount from original ask 20:56
It's the list to sales ratio. And for Atlanta as a whole, you're pretty much getting a discount of 3.9%. And the way that that works out, I know that on the last charts we just talked about, you know, seven to 10% off on those pending listings, but those are for like 40 to 50% of the listings. Remember, there's still 50 to 60% of those listings in Cobb, for example, that didn't need a price reduction.
So overall, from ask to uh sales price, it's 96.1%. So 3.9%. So really 4% off of the asking price is what the average property sells for. In Cobb, it's 96.7%. So in Cobb, you're getting an average of 3.3. Place like Forsyth, it's a little bit over 96.3. And then the only other places above the baseline, you've got Cherokee at 96.9, Halding County at 96.7, and Rockdale. In town, you know, DeKalb's under, so you're getting bigger discounts.
It's 4.5%. Take a look at Fulton. It's under slightly as well at 95.7. So, and then Gwinnett Gwinnett is uh underperforming here as well. 95.1% relative to the baseline.
Who sells under, at, or over asking now 22:09
So, interesting, wouldn't you say? Now, did sellers get their price? This is always interesting because this year 72.4% of all home sales are selling for less and asking. Are there still multiple offers? There are. there's 10% one out of 10 homes are selling for more. So if you price it right, you could get multiple offers and that price could go up. It happens in 10% of the cases. One out of 10 homes and then nearly, you know, 17.2, it's not quite 2 out of 10, uh, are selling right at the asking price.
So you can kind of see how that's trended. Uh, year over year over year, there are less and less and less homes selling for uh, you know, the asking price or more. They're selling for less than asking. Now, in terms of closing cost, you're also seeing more and more home sellers agreeing to pay closing costs. Of course, you are because you want to move the house. So, when a buyer is negotiating, they're getting money off the price of the house.
They're getting a portion of closing costs paid. So, it's a full two-thirds of home sellers are agreeing to pay closing costs. And of those who have agreed to pay closing costs, they're paying an average of almost $8,500. That's a very nice amount for a buyer that doesn't cover all of your closing costs these days, but it certainly makes a really nice dent into them. You can kind of see how that's trended over the last couple of years.
Um, when you look at how it breaks down by county, this is a new chart. So, there are parts of metro Atlanta where there are more closing costs being paid, more generous sellers basically who want to get their property sold. And in Fate County, you're looking at almost an average of 10 grand. That's huge, right? across the metro, we know that it's 84.81. So, Cobb 7,800. You take a look at Forsyth County 84.
Seller-paid closing costs trending up 23:56
Fulton 82, a little bit less. Uh, Gwinnett 86. So, there's some little bit of variance there depending on where you are. The hotter the market, the less the need to pay out closing costs. But, just to be clear, this isn't average closing costs overall. It's not averaged out with homeowners who paid zero. This is of the homeowners who did pay closing costs, which was 67%. How many of what was the average closing cost paid?
Because when you look at the whole, there's still 33% of the market that didn't. And if you're taking those averages, this will look a lot less. But I think it's important to know if someone's going to pay closing costs, what's the average that's being paid?
Closing costs by county, typical dollar amounts 24:33
Uh, so we can figure that out. Um, when you're making an offer, you're looking at the different houses. you can figure out very quickly if people are paying closing costs or not, if they're needing to pay closing costs or not. So, next, let's start getting into uh now this is going to show a percentage and I'm thinking ahead because the next couple slides after talk about home affordability. So, there's some really good stuff coming there.
And as always, if you want to get access to these slides, just there's a link in the comment for that first pin comment and in the description. Feel free to click the link, put in your information, and I'll send them to you so you can take a look at this stuff on your own time. I know I'm kind of zipping through this. That's the nice thing about creating four of these videos this month.
They're not going to be necessarily as long as they were because we're going to be a little bit more specialized in each video.
Concessions as a percent of price, where buyers save most 25:21
Okay, so those numbers that I just showed you, right? You take a look at the near 10 grand in fat. What is that percentage of the sales price? Again, looking at the percentage helps us to put everybody on the same footing to understand what that looks like because if you're getting 10 grand in the average sale there is a million dollars. Well, that's not as much of a percentage of what that sales price is.
But in fade, it works out to be roughly that 10 grand is roughly 2.1% of the sales price. So where the biggest deals are, they're on the perimeter, you know, southside perimeter basically. So anything that's like south of I20 when I talk about that. So Clayton 2.7, Douglas 2.6, and Rockdale 2.8. Uh in town, you know, you're looking at 1.8, Forsyth County 1.5. Uh I I I'm going to do this also for the luxury video.
We'll be able to break that down a little bit more. um a lot of um concessions are starting to be made available in that segment of the market as well. And I have a feeling that when we look at that, it won't be 1.5 for foresight. It's going to be quite a bit more. So any questions or things that you're wondering about, you know, with these stats, always feel free to drop a comment.
I read every single one. Be happy to answer any questions that you might have.
Affordability section begins 26:35
Let's jump into affordability. All of these next charts are brand new, but it's eye opening because it helps to explain how we got to this point.
Median price vs median income since 2012 26:43
So what am I talking about? This is what I'm talking about. Red is the median sales price in the month of September since 2012. All of this is year-over-year overear dating all the way back to 2012. So yes, we're 424990, but it rounds up to 425 on here. The black chart at the bottom, the bars at the bottom, that's median household income. not for all of Georgia, not for the US, for the Atlanta, Sandy Springs, MSA.
So, it's as local as it gets. It's taken from the US Census Bureau. So, in the metro, you can see how uh the median household income has scaled over time, but you also see how home prices have disproportionately scaled as well. And when you're using a portion of your income to be able to buy a house, it's taking more and more of your income to be able to get into the exact same house.
Cuz this is the medianpriced house, which you know at 425, depending on what part of town is like a 2,000 ft 3-bedroom, two bath or 42 and a half in some cases. You know, it's you're not getting more square footage as you're going up in price. It's the same house over the years. So, let's break these numbers down because it's very very telling.
Supply shock: closings to actives ratio and price spike 28:02
So, this here shows the close to active ratio over the median price. And when I'm looking at this, think of it this way. You're trying to understand or when I was looking at this, I wanted to help myself understand what pushed these prices up because they were going up. You know, obviously we were coming out of a housing crisis from 2007. when we hit the bottom of the market in 2012. And so there's only so far you can go before you hit bottom.
And the only way to look up after that is up. That's what we've seen. At some point in 2012, the median price house in Atlanta was $125,000. Can you believe that? We're at $425. It's $300,000 more just 13 years later. But look at this curve. like this curve was not my line sucks but my the curve was gentle here right up until 2020 2020 2122 it basically spiked up so what I did is I wanted to look at what was happening with supply shock and so I took a look at the number of closings that were happening relative to the amount of inventory and when you take a look at this it helps to explain like look at this you can see here what the ratio, you know, it was a very
it was a smaller ratio between 20 and 35%, meaning that you had if you had 100 houses in the market, you'd have 20 to 35 of them closing at any one time and then here 60% and then 80%. So if you had 100 houses in the market in that month, you had 80 of them closing. So there weren't enough houses. They were all being bought. And that was when as a buyer, you were going to look at one house.
You were taking off work because it just hit the market. And if you didn't do that, an hour later, it had 12,000 offers on it. And oh, by the way, you had to wait in line to get into that house, and you had to offer above the asking price, sometimes buy the house asis. Terrible decision. And an even worse decision is wave your appraisal, agree to pay the difference if it doesn't appraise.
you know, like you were giving away everything to be able to buy a house. And a lot of these houses were being bought by hedge funds with cash. I have a whole video on that if you haven't seen that video. But this is explaining why in a very short period of time, home prices just skyrocketed. Now, home prices are part of overall affordability because you've got home prices on one hand, you have income, how much money you have that you can put towards a house, and you have interest rates.
Well, let's look at that relationship next.
Income vs mortgage payment scaling, PITI on median home 30:49
So, when we factor those things in, you can see here the top one is your monthly income average, the median household income broken down by 12 months. You can kind of see how that scaled over these last 12 years. And the bottom one is how mortgage payments have scaled on the medianriced home. Now, this does factor in principal, interest, taxes, and insurance. So, take a look at how it scaled. In 2012, on the median pricriced home, the mortgage payment was $629.
Today, on that same median priced house, it's $2,800. That's a big increase, wouldn't you say? Like, it's hard to to really fathom in how just a little bit over a decade, you've gone from having something that was extremely affordable to having something that now is for a lot of people wildly unattainable. Right? So again, in 2021, see this bump here in from 2020 to 2022, mortgage payments doubled on the same house.
It's not you didn't get additional bedrooms and square footage and now you're in a luxury home that's double the price. The mortgage rates shot up. You went from 2 and a half 3% all the way up to 8.03% in October of 2023. And this is the result.
Share of income needed for the median home (then vs now) 32:10
And that leads us into a chart that is if the others didn't illustrate what's happening with housing affordability, this one definitely is going to be the one that brings in the home uh the run, right? So this is this is it. So when you take a look at this, it basically shows how much of the median household income is needed to afford the medianriced house. And in 2012, that median house was 125,000.
In 2025, that median price house is 425. 424990, right? 425 rounded up. So only 14% of that median household uh payment income basically was needed to make that housing payment. Now it's 37%. It's coming down a little bit. In 2022 and 2023 it was 40 to 41%. Now, if you've watched my video, I'm going to link it here in the cards, but I have a whole video on how much house you can actually afford by salary here in Atlanta, you would know that that is financial suicide to really give that much of your income towards a house, you know.
So, I feel strongly that you should be looking at net income and you should try and keep that at a third of your net after everything is uh taken out of your paycheck pay uh to put into housing. A lot of these calculators will have you focus on gross and they'll go all the way up to sometimes 43%. So if you're looking at those calculators and you're like, "Hey, 43% I can still do it."
This is red zone. This is not where you want to be. This is does not make financial sense. It's better to buy a house that would be under that median price income to get that ratio back in line so that you have more money left over at the end of the month and you're not putting all of your eggs in one basket. So, it's just really telling this year that 20 to 30% is really that comfort zone and for a while we were in that comfort zone and then we had supply shock and I have that whole video about the hedge funds coming in.
As a matter of fact, I met somebody for coffee this past week. We're talking about the market and they were telling me that they worked for one of the hedge funds and in Atlanta alone they have over 20,000 properties under management. Uh you see these companies everywhere. they buy the houses, turn them into rentals, and they they've bought a lot of houses over the last couple of years. So, that's one of the reasons that you have this.
Growth and migration context, why demand persists 34:38
But Georgia is also a big relocation state. We're supposed to grow by another 30% over the next uh 25 years. That's that 30% works out to be about 1.8 million people. They're going to need places to live. You know, that's one of the reasons why there are so many multifamily properties that are being built. builders are building a whole bunch of 55 plus communities. You have build to rent communities for single family homes popping up everywhere.
A lot of those hedge funds are uh in that business as are some of these local builders and everything in between. Single family homes that are for sale. So, what's going to happen is over the short term, I think we're going to see a price correction.
Short-term outlook, price correction vs crash 35:12
I think that seeing that median price come down just a little bit is indicative of that. I think there's a big seasonality of it as well. We're heading into the slower part of the year. Although this time last year when we headed into fall, the price stayed 425. This year it's down by 10 bucks. So, it's gonna be really interesting to see over the next 30 days when I do this next video where that median price went.
But I do expect prices to come down a little bit. But in the long run, it's not going to crash. It's going to correct ever so slightly and then it's going to continue its journey back up. So, as a buyer, I think there's an opportunity in the marketplace right now. You're seeing sellers who are more negotiable. Uh there are more price cuts on active inventory. You saw in this video by how much the pendings had to discount for just to go under contract and then concessions are up.
Um the only thing that's not super friendly right now are interest rates.
Rates snapshot and smart buyer strategy 36:07
They're still in the sixes. They were trending down and now they're back up to like 6.35 as of the filming of this video, but there's an eb and flow to that. So, if you can afford the interest rates in the uh next little while, you know, maybe refinance in the future. With that said, caveat, I'm not the biggest date the rate, marry the house kind of guy because I feel very strongly that you should be able to afford the payment that you have.
And if you're overextending yourself with the hope that the rates will come down so you can refinance in the future, nobody wants that because what if they don't come down, right? Everybody expects that they're going to come down, but be smart about how you make those decisions.
Get the slides link, playlist details 36:47
As always, if you want to go through these slides at your own pace, I've got the link to the report in the comments, the first comments, as well as the description. Click the link, pop in your information, and I'll send it to you. You're going to watch more videos today. This is the playlist that's going to contain all of this month's videos. So, in a couple days, you're going to have the North Atlanta video, the in town video, the luxury video for the month.
They're all going to be there. Otherwise, let's put another video over here.
Watch next, affordability by salary video 37:12
Let's do the how much house you can afford in Atlanta based on your actual salary since I talked about it in this video. Thanks so much for watching and I hope to see you on the next

About Terence Richardson
Terence Richardson is a Realtor with Compass and the founder of the Terence Richardson Group, which serves Metro Atlanta. He publishes Atlanta’s Housing Market Update every month on YouTube and in The Richardson Report.
