Plays here from YouTube when you press play. Open on YouTube
Published . Prices, rates and counts in this video were current on that date. This month's numbers are on Market Data.
What is this video about?
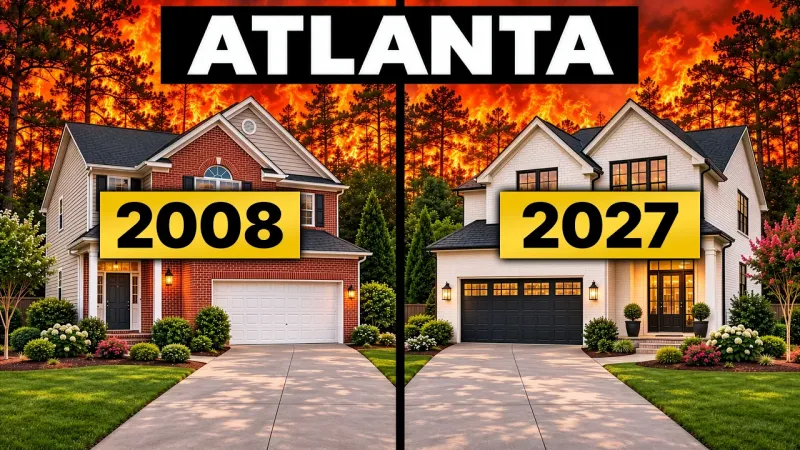
“This Is What "ALWAYS" Happens Before A Real Estate Crash In Atlanta” is a 16-minute video by Terence Richardson, a Realtor with Compass in Metro Atlanta. It was published on October 13, 2026 on his YouTube channel, Terence Richardson - Atlanta Real Estate.
The last time Atlanta's housing market crashed, there were 5 warning signs first. By 2008, all 5 were flashing red.
Today, 4 of those same signals are yellow and 1 is still green. So in this video I score all 5 using Atlanta MLS data, show you the exact number that flips each one red, and tell you what I think happens heading into 2027.
You'll also see where the line actually ran in 2008. Starter homes lost two-thirds of their value. The top of the market took less than half the damage. Same metro, same crash, very different outcomes.
Transcript
This comes from YouTube’s automatic captions, set into paragraphs. Place names the captions misspelled were corrected. One figure the captions misheard was corrected after checking it against the video’s script or a second transcription. Nothing else was added or reworded. Captions can still mishear a word or a number, so check a figure against the video before you rely on it. Captions read November 16, 2026.
The 5 warning signs before Atlanta's last crash 0:00
The last time Atlanta's housing market crashed, there were warning signs first. Five of them to be exact. And by 2008, all five were flashing red. By 2012, starter homes in this metro had lost 2/3 of their value. And it took them 11 years just to get back to even. But Atlanta didn't crash evenly. The top of the market took less than half of the damage. Which side of that line you were on decided everything.
Today, I'm tracking those same five signals straight from the MLS. Four are flashing yellow, one is still green, and Georgia just posted the third biggest jump in foreclosure activity in the country. By the end of this video, you'll know the exact number that flips each signal red. And heading into 2027, how to tell a slowdown from the start of something worse.
The 3 levers that move home prices 0:49
The three levers. Now, here's how home prices actually move. It comes down to three things: rates, wages, and confidence. Rates and wages decide what buyers can afford. Confidence decides whether they act on it. In the early 80s, rates broke the market. In 2008, it was lending. Different trigger every time. But Atlanta has a fourth lever that places like California don't. We can actually build. There's a lot of new construction. So, when things slow down here, Atlanta doesn't fall off a cliff.
More homes hit the market. Prices stall out and inflation, well, it quietly eats away at what your house is really worth. Now, hold on to that because it's going to explain the single strangest number in this entire video. But next, let me show you what happened the one time all five signals fired here at once.
What happened in Atlanta in 2008 1:43
This is Atlanta in 2008. So 2005, metro Atlanta felt unstoppable. Subdivisions were rising out of cow pastures in Henry, Douglas, Paulding, South Fulton, really everywhere. Money was cheap, lending was reckless, and builders were still building for demand they'd seen years earlier. By 2006, roughly one in four home purchase loans in America was a high-cost subprime style loan. Then the trigger arrived. Georgia unemployment peaked at 10.6% in January of 2010. Atlanta prices fell almost 40% from the July 2007 peak to the March 2012 bottom.
So here's where that line actually ran. And this is the part that matters to you. The Atlanta that crashed, the lower price third of the metro, the starter homes, a lot of them on the south side down 66%. 2/3 of the value gone. So a 200,000 house back then was worth 70,000 at the bottom. The Atlanta that held the top third, the Buckhead, East Cobb, Johns Creek, that price range down 31%.
I mean, that's still painful, but that's less than half the damage. The difference was down payments, land, and demand that doesn't go away, right? Good schools, good jobs. You can't drop a brand new 300 home subdivision in Buckhead. and Alfreda held up because Alpharetta is Alpharetta. Same line still there.
The 5 signals and how I score them 3:17
Keep that in mind when we get to the scorecard. Five signals, prices, lending, builders, delinquencies, and the trigger. Green means we're fine. Yellow means watch it, and red, well, it means it's breaking.
Signal 1: Prices 3:28
So, let's score them. Signal one, prices. So, take a look at this. The median price of a single family home in core Atlanta counties right now is 420. That's right, 420. Last August 420. The August before 420. Two years, not $1 of movement when it comes to the median price. Now look at months of supply. That's how long it would take to sell every home in the market if nobody listed another one.
Right? 2.7 3.7 now 3.9. Under five is a sellers market. Five to six is balance. over six is a buyer market. Now, here's the part that nobody wants to say out loud. Flat doesn't mean flat, right? Prices held still, but inflation didn't. 2.9% one year, 3.4% the next. So, after inflation, Atlanta homeowners are down actually 6%. On a $420,000 house, call it $25,000 of buying power that quietly disappeared. It's not a crash, it's a correction.
And it's already happens. It just hid inside of your grocery bill, your insurance premium at the gas pump instead of showing up on your Zestimate. That's the building lever doing exactly what I said it would. Now, this one flips red when months of supply hits six. We're at 3.9, which is still technically a sellers market. So, why yellow? Well, because supply is up almost 45% in just 2 years. And after inflation, prices are already going backwards.
Heading into 2027, it's trending towards red but slowly. Supply added a full month in 2025 and just 0.2 in this year.
Signal 2: Lending 5:09
Signal two, lending. So prices are telling you the corrections already here. But prices alone didn't crash this market in 2008. Lending did. Remember that green light I mentioned? This is it. In 2006, one in four purchase loans in America was subprime. Today, lending borrowers under a 620 credit score has all but disappeared. Post crisis rules actually did their job. This one flips red if adjustable rate mortgages go over 15% of new loans or if lenders start approving people who spend more than 45% of their income on debt.
Heading into 2027, it's holding green. The one to watch is adjustable rates. Right now, they're almost 10% of mortgage applications, call it 1 and 10, and climbing. Now, adjustable rate mortgages start to look so much more interesting when fixed rates stop working, like when they're 7.43%.
Signal 3: Builders 6:08
Signal three, builders. So, lending's clean, which means if there's pressure, it's coming from somewhere else. And right now, it's coming from the builders. Builder confidence on a scale of zero to 100 just came in at 32, down three points in a month. Anything under 50, more builders say conditions are bad than good. And we've been under 40 for 17 straight months. 38% of builders cut prices this month. Average cut 6%. And two out of three are now using incentives.
Take Toll Brothers for example, one of Atlanta's premier home builders. Their growth in Georgia over the years has been nothing short of remarkable. In one of their newer neighborhoods to the north of the Atlanta suburbs, they now have multiple homes with six figure price cuts, some as high as 200,000. Remember, the national cuts is 6%. Out here, it's 10 to 19%. But here's the thing, these price cuts aren't the real story.
The rate buydowns are, and they're really, really hard to see. When a builder pays to lower your rate, say seven down to 6%. You get the same monthly payment as a 10% price cut, right? So cost the builder around 3%. And it never shows up in the sales price. So builders get to keep the prices high. Prices look firm, but the real discount is hidden. County new construction is at 10.1 months of supply.
Cherokee County went from 4.1 to 6.3 in just 2 years. Both are now in buyers market territory. This one flips red if builder confidence stays under 30 for two quarters in a row or if new construction supply across the metro passes 6 months. We're at 5.6 right now. So heading into 2027, it's trending towards red. New construction supply went from 5.3 to 5.6 months in a year.
Signal 4: Delinquencies 8:01
Signal four, delinquencies. Now builders could absorb a price cut, but the people who bought with three and a half% down can't. That's the FHA loan and that's signal number four. Almost 12% of FHA borrowers are behind on their mortgage. That's up more than a full point from a year ago. Now, you've seen the headlines calling that the worst since 2008. That's not even close. It was higher than this in 2011 at 12.6% and far higher during COVID.
Elevated, not catastrophic. Regular conventional loans sit at 2.72%. FHA runs a full nine points ahead. That tells you that the bottom rung of the ladder is buckling while the middle and top are still holding fine. Remember that foreclosure number from up top. Third biggest jump in the country, up 52% in the first half of this year. I know that's a scary number and almost always it's a mystery because a foreclosure start is a warning letter.
It's not a lost house. As a matter of fact, almost none of it is reaching the resale market. I went through every single closed sale in my archive going all the way back to 2010. In 2011, one out of every three homes sold in metro Atlanta was bank-owned or a short sale. This year, it's 1.2%. Call it 1 in 80. I mean, it's still a huge, huge difference right now. That's up from the 2021 low, but it's nowhere near a wave at this point.
So, here's what I think is happening. owners who fall behind. I mean, they're getting the foreclosure letter, but then they're getting out, right? Because they have equity in their houses. And before they ever let the bank take the house back, they're choosing to sell the house on their own terms. In 2008, falling behind with no equity meant foreclosure. Today, falling behind with equity means a normal sale. Equity is the escape valve.
Now, this one flips red if FHA delinquencies hit 15% or if actual foreclosures start keeping pace with the starts. Heading into 2027, it's holding steady, but high up on the year, flat on the quarter.
Signal 5: The trigger 10:11
Signal five, the trigger. So, the distress is there, but equity is still catching it, which means the real question is, what could take that equity away? Well, that happens to be our trigger. Let's start with jobs. UPS, headquartered right here, announced up to 30,000 cuts back in January as it cuts back on Amazon deliveries. And the other half of the trigger move this month. The Fed raised rates and mortgage rates just crossed 7% up from 6.3% just a year ago.
To be fair, Georgia unemployment right now is 3.2%. That's a two and a half year low. But it flips red if Atlanta unemployment goes to 6% for two straight quarters or if more people start moving out of the metro than moving in. Heading into 2027, it's a split. Rates are heading towards red and the mortgage bankers association expects two more Fed hikes. Jobs are heading the other way.
The full scoreboard 11:11
All right, so prices are yellow, lending is green, and it's carrying the whole board right now. Builders are still leaning yellow. Delinquency is yellow. The trigger is yellow, but it just moved. So score today, we've got four yellows and one green. Now trending into 2027, builders and prices are moving towards red. Delinquencies are holding steady. The trigger is split and lending is holding green. And here's the thing about holding this market up right now.
Owners with a low rate, they don't want to sell. And their payments stay cheap. Just half of all American mortgages right now still carry a rate at or below 4%. But back in 2022, it was 65%. So that cushion is getting thinner.
The strongest case against a crash 11:54
Before I give you the verdict, here's the strongest case against everything I just said, and it happens to be a good one. Atlanta's weakness isn't buyers disappearing, it's supply catching up. We built, more homes hit the market, and prices stopped climbing. That's the building lever working exactly as designs. Households spends 11% of their income on debt payments. Right before 2008, it was almost 16%. And outside of FHA, late payments are at near historic lows.
So, what I'm calling warning signs may just be what a healthy market correction actually feels like from the inside. But here's how you tell the difference, and it's one test. A healthy correction is when prices soften while home sales hold steady. Something breaking is when prices soften and sales also fall off a cliff. On the year, closings are holding. January through August, flat, maybe up about a half a percent. But take a look at this August.
There were 3654 closings, the fewest for any August in my data going all the way back to 2013. That is not a typo. and pending sales. Those are the contracts that become closings next month, right? Well, they drop 14%. Also the fewest August on record in my data. That number usually gets revised up a little bit, but it's still a really big gap. So, the test passes on the year and it's starting to fail on the month.
Will Atlanta crash in 2027? My verdict 13:21
So, will Atlanta crash in 2027? Well, here's what I think. I think there are real cracks in this market and they're getting a little bit wider, but it still hasn't broken. In Atlanta, 2008 meant 40% price drops and one in three sales coming out of distress. Today, prices are flat and about 1 in 80 are distress sales. And the forecasters aren't calling for a crash either. Zillow expects national home prices to be flat through next June.
And mortgage rates are expected to stay in the high sixes into 2027. So, my base case for 2027 isn't a crash. I see it as a long, flat grind with inflation doing most of the cutting. Here's what would change my mind, though. Pending sales staying down 10% or more through this winter. FHA delinquencies hitting 15% or Atlanta unemployment going over 6%. If two of those flip, 2027 starts to look a lot more like 2008.
And I'll tell you, history doesn't repeat, it rhymes. And right now, Atlanta is rhyming.
If you're buying 14:27
But it's not repeating. So, here's how I would play it right now. If you're buying, don't let a lender push you to the top of your pre-approval. That number is built on your income before taxes, and you don't live on that. Run the numbers based on what you actually take home. Cuz here's the trap, and I'm watching people walk right into it right now. Take Summer Hill Town Homes, right? sold in the fives just about two years ago, brand new.
Now, those properties are trading in the 400s. FHA buyers, VA, low down payment borrowers, they're all underwater, and they can't sell without bringing cash to the table or doing a short sale. That's not a forecast. That's happening in the metro this year. So, we've got two rules. The first one, if you buy where builders are still putting up new homes today, plan to stay for seven years or more. The average person stays in their home 10 plus now.
Prices here topped out in the summer of 2024 and they haven't moved since. Plan for a long flat stretch into 2027, not a quick bounce. Two, buy with a longer time horizon or buy where people will always want to live. Think good schools, close to jobs. The people who bought at the peak in 2007 and never sold, well, Atlanta prices are about 85% above that peak. My experience, time fixes almost everything.
What hurts people is being forced to sell before you're ready.
If you're selling 15:49
Now, if you're selling, price for the market that you're in, not the 2022 market when buyers were fighting over every single listing. Waiting for that market to come back isn't a strategy. In my experience, three things sell a house in any market. price, condition, and marketing. Overshoot the price to test the market, and you spend your best weeks proving your own number wrong. Now, if you're thinking about buying or selling and you want to know what's happening in the market right now, I definitely think you should watch this video

About Terence Richardson
Terence Richardson is a Realtor with Compass and the founder of the Terence Richardson Group, which serves Metro Atlanta. He publishes Atlanta’s Housing Market Update every month on YouTube and in The Richardson Report.
