PRESS RELEASE
FOR IMMEDIATE RELEASE
August 26, 2026
Atlanta's Two-Speed Market
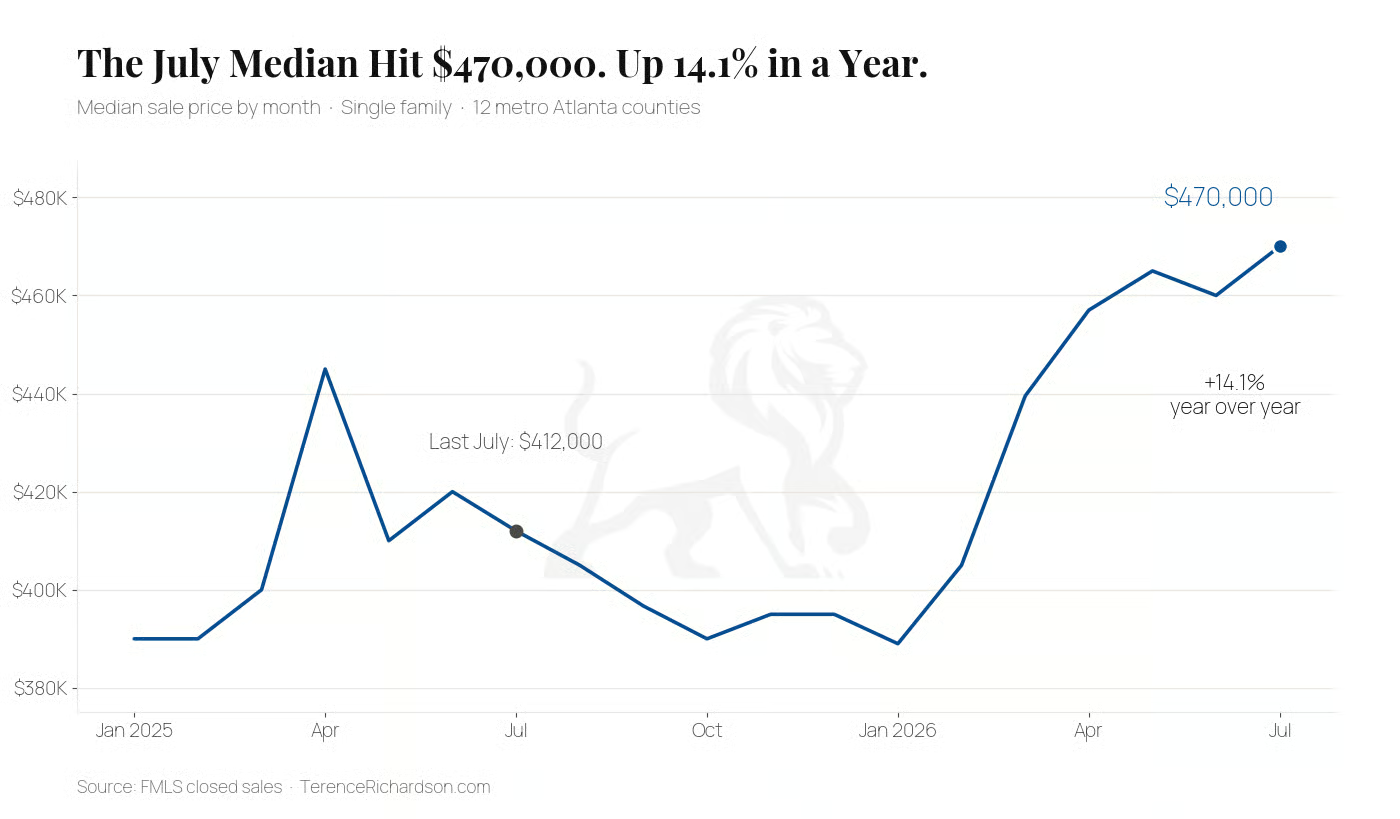
Atlanta housing, by the numbers. July closed data, 12 counties. Read time: 5 minutes. THE NUMBER: $470,000 That's the median price of a single family home that closed in metro Atlanta in July. Same month last year: $412,000. Call it a 14% jump, $58,000 on the median house. That is not a typo. Now here's the part the headlines will miss. While that was happening, nearly half of everything sitting on the market took a price cut. Both of those things are true at once, and if you understand why, you understand this market. More on that below. What moved Inventory: 15,026 single family homes active across the 12 core counties, which works out to 3.9 months of supply. Under the old rule of thumb, that's balanced with a slight lean toward sellers. (Source: FMLS, July snapshot.) Pricing: 47.1% of active listings have taken at least one price reduction. So call it one out of every two homes on the market right now has already cut its price at least once. (Source: FMLS actives, July.) Rates: 6.65% on the 30-year fixed as of August 20, down two straight weeks, and almost exactly where it sat a year ago at 6.58%. Rates are not the story this year. (Source: Freddie Mac PMMS.) Your market Metro first, then your county. If you gave me your zip code, the county card below is already yours. Metro Atlanta in July Metric July 2026 vs July 2025 Median sale price $470,000 +14.1% Closings 3,845 +12.1% Median days on market 26 29 last year Price-cut share (actives) 47.1% — Months of supply 3.9 — What's selling is selling higher and a little bit faster than last July. What's not selling is getting cut. Both are true at once: this is a two-speed market. Want your county's numbers here? You're seeing the metro view because I don't have your zip code yet. Add it once and every issue opens with your county's actual numbers, not the metro average. Hit "manage your preferences" at the bottom of this email. Takes ten seconds. The play If you're buying: the two-speed market is your map. The fresh, well-priced listings are moving in under four weeks, so if a good one appears, you don't have a month to think. But that 47% cut list is where your leverage lives: those sellers have already admitted the first price was wrong, and every one of them is doing the math on a second cut. Shop both lanes and know which lane the house you want is in. If you're selling: the first 30 days are almost everything. In July's closed data, the typical home that went under contract inside 30 days got its full first asking price. The typical home that took longer settled at 94.8% of first ask. On the median Atlanta house, call it $24,000. Price it right on day one, because the market has stopped paying for optimism. From the channel I walk through this month's full slide deck on camera, including the charts behind that 14% number. One more thing One ask this month: hit reply and tell me the one question about the Atlanta market you want answered in the next issue. I read every reply, and the best question becomes a section. See you next month. // Terence Numbers: FMLS closed sales and active inventory, single family, 12 core metro counties, July 2026 with data through August 7. Rates: Freddie Mac Primary Mortgage Market Survey, August 20, 2026. Medians shift with the mix of what sells; where the mix moved the number, I said so.
July 23, 2026
More Homes, Cooler Heads
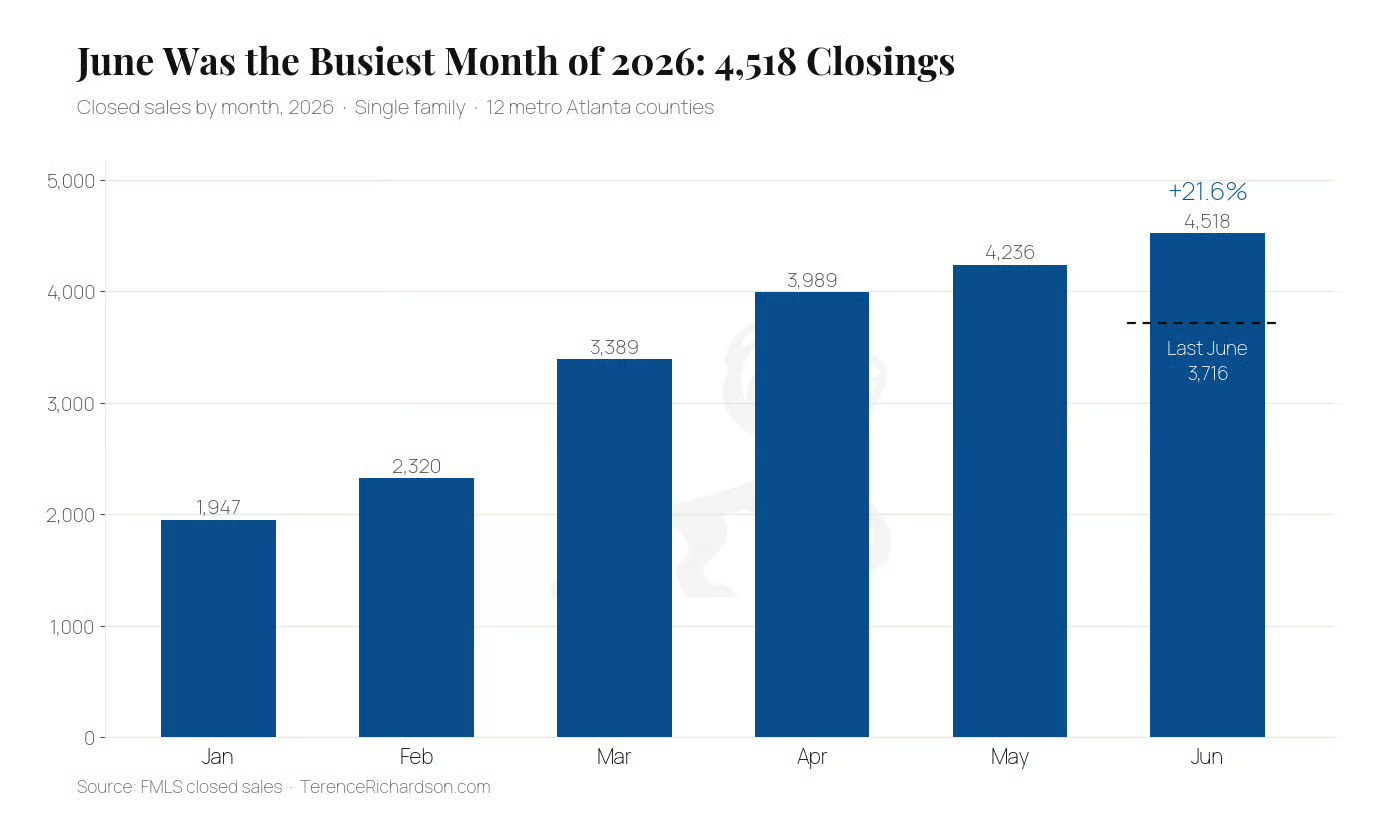
Atlanta housing, by the numbers. June closed data, 12 counties. Read time: 5 minutes. THE NUMBER: 4,518 That's how many single family homes closed across the 12 core counties in June. It's 21.6% more than last June, and the busiest month of 2026 so far. So no, the Atlanta market did not freeze. It did something more interesting: it downshifted. Last month this newsletter was called The 18-Day Market. In June the median climbed to 21 days, supply rose from 2.8 months to 3.3, and the share of listings cutting price eased from 48.9% to 44.3%. More homes, more closings, slightly cooler heads. That's not a warning sign. That's a market finding its balance. What moved Inventory: 14,934 single family homes active, up meaningfully from May as summer listings arrived, which works out to 3.3 months of supply. Still leaning seller, but buyers finally have choices. (Source: FMLS, June snapshot.) Pricing: the median June sale closed at $460,000, up 9.5% from $420,000 last June. Meanwhile 44.3% of active listings have taken at least one price cut. (Source: FMLS.) Rates: 6.58% on the 30-year fixed as of July 23. A year ago: 6.74%. Rates keep refusing to be the story. (Source: Freddie Mac PMMS.) Your market Metro first, then county by county. Metro Atlanta in June Metric June 2026 vs June 2025 Median sale price $460,000 +9.5% Closings 4,518 +21.6% Median days on market 21 22 last year Price-cut share (actives) 44.3% — Months of supply 3.3 — A fifth more closings than last June at prices nearly ten percent higher. The volume tells you demand is deep; the extra supply tells you the frenzy is easing. Good month to be a well-priced listing, better month to be a prepared buyer. Fulton County in June Metric June 2026 vs June 2025 Median sale price $648,000 +22.5% Closings 875 +23.1% Median days on market 19 21 last year Price-cut share (actives) 44.4% — Months of supply 3.2 — 875 closings, the most of any county, and a median that jumped 22.5%. Part of that jump is mix, more high-end product closing up north, but Fulton's momentum is not a rounding error. Cobb County in June Metric June 2026 vs June 2025 Median sale price $495,000 +11.8% Closings 728 +23.0% Median days on market 18 15 last year Price-cut share (actives) 43.7% — Months of supply 2.7 — Still the tightest big county at 2.7 months of supply. Closings up 23% and prices up nearly 12%. Cobb remains the metro's pressure cooker. DeKalb County in June Metric June 2026 vs June 2025 Median sale price $425,000 +13.3% Closings 608 +11.2% Median days on market 16 23 last year Price-cut share (actives) 44.1% — Months of supply 2.7 — 16 days median, a full week faster than last June, with 2.7 months of supply. DeKalb quietly matched Cobb for tightness this month. Gwinnett County in June Metric June 2026 vs June 2025 Median sale price $440,000 +1.1% Closings 816 +19.3% Median days on market 21 20 last year Price-cut share (actives) 42.4% — Months of supply 3.5 — Huge volume, 816 closings, but prices basically flat at +1.1%. Gwinnett is the value play among the big four right now. Cherokee County in June Metric June 2026 vs June 2025 Median sale price $495,000 +4.2% Closings 380 +45.0% Median days on market 19.5 22 last year Price-cut share (actives) 47.1% — Months of supply 3.1 — Closings up 45% for the second straight month. Cherokee is where the metro's growth is actually happening, one closing table at a time. Forsyth County in June Metric June 2026 vs June 2025 Median sale price $650,000 -14.2% Closings 360 +71.4% Median days on market 25 19.5 last year Price-cut share (actives) 48.1% — Months of supply 3.4 — Forsyth again: median down 14%, closings up 71%. Same story as May, louder. This is an entry-level wave washing through a luxury county, and it's changing who can afford to live there. Paulding County in June Metric June 2026 vs June 2025 Median sale price $380,000 +10.1% Closings 250 +18.5% Median days on market 30 31 last year Price-cut share (actives) 45.7% — Months of supply 3.6 — A real bounce-back month: prices up 10%, closings up 18.5%. Last month's soft spot found its footing. Henry County in June Metric June 2026 vs June 2025 Median sale price $367,985 +0.4% Closings 158 +6.8% Median days on market 39 36 last year Price-cut share (actives) 42.2% — Months of supply 5.0 — Five months of supply and 39 days on market: the metro's slow lane, and the closest thing to a true buyer's market on this page. Douglas County in June Metric June 2026 vs June 2025 Median sale price $323,250 -2.0% Closings 126 -6.0% Median days on market 35 40.5 last year Price-cut share (actives) 43.2% — Months of supply 4.6 — Slightly fewer closings at slightly lower prices. Douglas is drifting sideways, which for a buyer means time to think, a luxury most of the metro doesn't offer. Clayton County in June Metric June 2026 vs June 2025 Median sale price $250,000 +2.9% Closings 111 -8.3% Median days on market 32 25 last year Price-cut share (actives) 43.1% — Months of supply 4.1 — Still the metro's most affordable county at a $250,000 median. Slower this month, which cuts both ways: fewer sales, more negotiating room. Rockdale County in June Metric June 2026 vs June 2025 Median sale price $322,450 -0.2% Closings 66 0.0% Median days on market 34 28 last year Price-cut share (actives) 43.9% — Months of supply 5.0 — Flat everything on small numbers. Rockdale took June off. Fayette County in June Metric June 2026 vs June 2025 Median sale price $465,000 +3.9% Closings 40 +33.3% Median days on market 25 22.5 last year Price-cut share (actives) 44.3% — Months of supply 5.8 — Forty closings is a small sample, so hold every Fayette number loosely. Faster than May, still nearly six months of supply. Negotiate. The play If you're buying: this is the best buyer's month of 2026 so far, and not because prices dropped. It's because choice arrived: inventory built all through June while the pace eased off May's sprint. You can now see a house twice before offering in most of the metro. Use the breathing room to be picky, not passive: the good ones still go in under three weeks. If you're selling: your competition just grew. Nearly 15,000 active listings means your launch price is competing with more alternatives than at any point this year, and 44% of the sellers around you have already cut. The winning move hasn't changed since spring: price against what's PENDING in your neighborhood, not what's sitting. From the channel I walk through this month's full slide deck on camera, chart by chart. One more thing Want next month's numbers in your inbox instead of hunting them down? The signup is on the homepage. One email a month, your county's numbers, five minutes. That's the whole pitch. See you next month. // Terence Numbers: FMLS closed sales and active inventory, single family, 12 core metro counties, June 2026. Rates: Freddie Mac Primary Mortgage Market Survey, July 23, 2026. Medians shift with the mix of what sells; where the mix moved the number, I said so.
June 25, 2026
The 18-Day Market
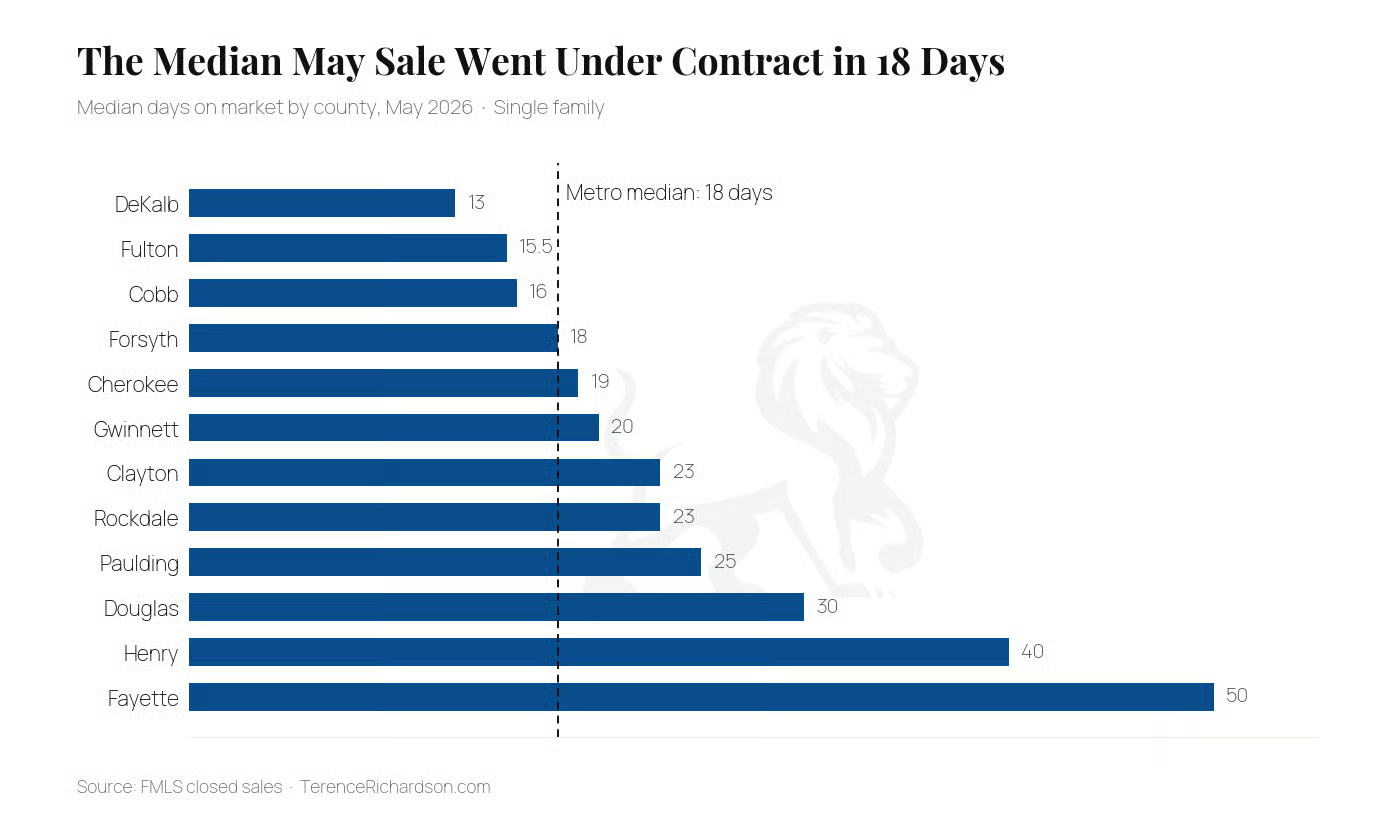
Atlanta housing, by the numbers. May closed data, 12 counties. Read time: 5 minutes. THE NUMBER: 18 days That's how long the median single family home that closed in May sat on the market before going under contract. Eighteen days. Two and a half weekends. And here's the strange part: while homes were moving that fast, 48.9% of everything still sitting on the market had already taken a price cut. Call it half the board. Fast market, impatient sellers, both at once. Hold that thought, because the county numbers explain it. What moved Inventory: 11,966 single family homes active, which works out to 2.8 months of supply. That's tight. Under the old rule of thumb, anything under four or five months leans seller. (Source: FMLS, May snapshot.) Pricing: the median May sale closed at $465,000, up 13.4% from $410,000 last May. And yet 48.9% of active listings have cut their price at least once. The market is paying up for the right house and punishing the wrong price. (Source: FMLS.) Rates: 6.49% on the 30-year fixed as of June 25, and it's been sitting in that range for six straight weeks. A year ago it was 6.77%. Slightly cheaper money, much faster market. (Source: Freddie Mac PMMS.) Your market Metro first, then county by county. Metro Atlanta in May Metric May 2026 vs May 2025 Median sale price $465,000 +13.4% Closings 4,236 +14.0% Median days on market 18 19 last year Price-cut share (actives) 48.9% — Months of supply 2.8 — Fourteen percent more closings than last May at prices thirteen percent higher. Whatever the national headlines say about a frozen market, Atlanta didn't get the memo this spring. Fulton County in May Metric May 2026 vs May 2025 Median sale price $637,500 +19.2% Closings 760 +4.1% Median days on market 15.5 17 last year Price-cut share (actives) 47.9% — Months of supply 3.3 — Fastest county in the metro at 15.5 days. The 19% median jump is partly mix, more high-end product closing, but the speed is real everywhere. Cobb County in May Metric May 2026 vs May 2025 Median sale price $485,000 +10.9% Closings 742 +28.4% Median days on market 16 13 last year Price-cut share (actives) 50.4% — Months of supply 2.1 — 2.1 months of supply is the tightest number on this entire page. Cobb buyers, bring your A offer the first weekend. DeKalb County in May Metric May 2026 vs May 2025 Median sale price $477,000 +36.3% Closings 554 +9.1% Median days on market 13 18.5 last year Price-cut share (actives) 50.6% — Months of supply 2.5 — Before you screenshot that 36%: that's mix, not appreciation. Pricier product made up much more of what closed this May. The 13 days on market, though? That part is very, very real. Gwinnett County in May Metric May 2026 vs May 2025 Median sale price $444,000 +6.3% Closings 773 +15.4% Median days on market 20 19 last year Price-cut share (actives) 46.7% — Months of supply 3.0 — Most closings of any county, steady 6% price growth, nothing dramatic. Gwinnett is the metro's metronome. Cherokee County in May Metric May 2026 vs May 2025 Median sale price $520,000 +15.6% Closings 378 +43.7% Median days on market 19 13 last year Price-cut share (actives) 47.7% — Months of supply 2.7 — Closings up 43.7%. Take a look at that again. Cherokee is absorbing a wave of new supply and barely slowing down. Forsyth County in May Metric May 2026 vs May 2025 Median sale price $661,000 -11.9% Closings 294 +45.5% Median days on market 18 15 last year Price-cut share (actives) 51.1% — Months of supply 3.5 — A median down 12% while closings jump 45% is not falling values. It's different homes selling: a lot more entry-level product than a year ago. Watch this one, it's a trend now, not a blip. Paulding County in May Metric May 2026 vs May 2025 Median sale price $359,175 -1.6% Closings 222 -0.4% Median days on market 25 29 last year Price-cut share (actives) 52.9% — Months of supply 3.4 — Flat prices, flat volume, and the highest cut share in the metro at 52.9%. Paulding sellers are negotiating; Paulding buyers should let them. Henry County in May Metric May 2026 vs May 2025 Median sale price $354,700 +2.1% Closings 157 -14.7% Median days on market 40 47 last year Price-cut share (actives) n/a — Months of supply n/a — Closings down 15% and 40 days on market: the slow lane of the metro. (Henry's inventory snapshot didn't make it into this month's data pull, so no supply figures this issue.) Douglas County in May Metric May 2026 vs May 2025 Median sale price $337,700 +10.5% Closings 115 -5.7% Median days on market 30 24 last year Price-cut share (actives) 49.1% — Months of supply 4.2 — Prices up 10.5% but everything else says slower: fewer closings, longer waits, 4.2 months of supply. A market catching its breath. Clayton County in May Metric May 2026 vs May 2025 Median sale price $254,500 -5.7% Closings 126 +3.3% Median days on market 23 43 last year Price-cut share (actives) 47.8% — Months of supply 3.1 — Days on market nearly cut in half, 43 to 23, at the metro's lowest prices. Clayton is where first-time buyers still have a real shot, and they clearly know it. Rockdale County in May Metric May 2026 vs May 2025 Median sale price $330,000 -2.5% Closings 85 +2.4% Median days on market 23 32 last year Price-cut share (actives) 46.4% — Months of supply 3.5 — Small county, steady numbers, faster than last year. Nothing to fix here. Fayette County in May Metric May 2026 vs May 2025 Median sale price $512,500 +20.6% Closings 30 -3.2% Median days on market 50 17 last year Price-cut share (actives) 46.0% — Months of supply 6.3 — Thirty closings is a small sample, so read every Fayette number gently. But 50 days on market and 6.3 months of supply both say the same thing: slow and negotiable. The play If you're buying: at 18 days median, the well-priced house you toured Saturday can be gone by the second Tuesday. Get underwritten before you shop, not after you fall in love. But don't ignore the other half of the market: nearly one in two listings has already cut its price, and a seller who's cut once is a seller doing math. If you're selling: this market rewards the right launch price violently and punishes the wrong one just as fast. Half your competition already blinked. Price to sell in the first two weekends and you'll likely never need a reduction; price to "leave room to negotiate" and you become the price cut statistic in next month's issue. From the channel I walk through this month's full slide deck on camera, chart by chart. One more thing Want next month's numbers in your inbox instead of hunting them down? The signup is on the homepage. One email a month, your county's numbers, five minutes. That's the whole pitch. See you next month. // Terence Numbers: FMLS closed sales and active inventory, single family, 12 core metro counties, May 2026. Henry County's inventory snapshot was unavailable this month; metro supply figures cover the remaining 11 counties. Rates: Freddie Mac Primary Mortgage Market Survey, June 25, 2026. Medians shift with the mix of what sells; where the mix moved the number, I said so.