Plays here from YouTube when you press play. Open on YouTube
Published . Prices, rates and counts in this video were current on that date. This month's numbers are on Market Data. Terence Richardson joined Compass in September 2025, after this video was published.
What is this video about?
“Atlanta's Housing Market Update (August 2025)” is a 39-minute video by Terence Richardson, a Realtor with Compass in Metro Atlanta. It was published on August 6, 2025 on his YouTube channel, Terence Richardson - Atlanta Real Estate.
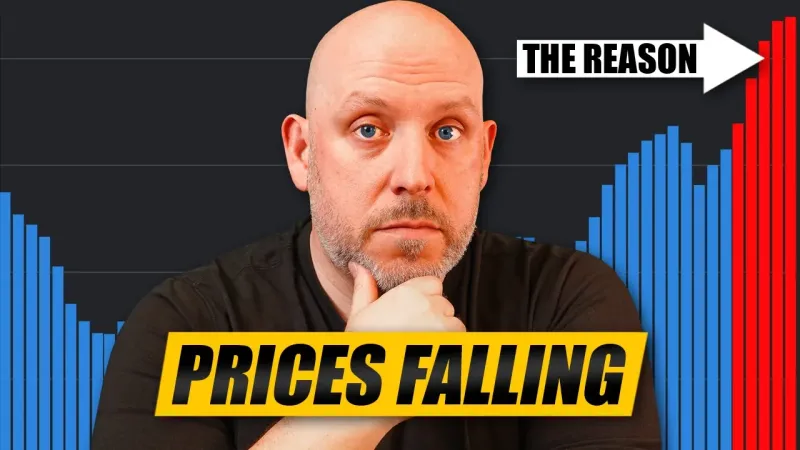
Nearly half of all active listings have had one or more price reductions, some more than one. We'll take a look at the July stats to find out where prices are starting to fall and how the market is starting to crack.
Transcript
This is the caption file published with the video, set into paragraphs. Place names the captions misspelled were corrected. 6 figures or words the captions misheard were corrected after checking them against the video’s script or a second transcription. Nothing else was added or reworded. Captions can still mishear a word or a number, so check a figure against the video before you rely on it. Captions read November 16, 2026.
Prices Are Falling | Atlanta Housing Market Update (August 2025) 0:00
The median sales price in Atlanta might look nice and stable, but when you dig into the data, you'll see that nearly half of all listings are currently slashing their prices across metro Atlanta. And in some areas, it's even more than half. Even in some of the most resilient zip codes, one out of three sellers are starting to flinch on price. This isn't a calm market. It's one that's recalibrating quietly but fast.
This is your August Atlanta housing market update. Let's dive right into it.
Why all the reductions? 0:29
So, when I say that nearly half of all listings have had their prices slashed, why is that? Well, I think personally it's because you have a lot of home sellers that tried pricing their houses too high, right? Market's not responding there. A little bit later in the video, I'm going to show you where we're at with active inventory relative to sales. That's mind-blowing. When you see what's happening there, you'll understand why a lot of these listings are having price adjustments.
We'll be taking a look at data on days on market, months of supply, all of those factors that help to explain why there are so many price cuts, but ultimately comes down to home sellers who've overpriced their homes and the market's not there to pay them what they want. So now they're trying to find the right price by coming down either a little bit or a lot.
Price reductions by county 1:11
So when you look at it broken down by county, you can see here what that distribution looks like. So this first one here is greater Atlanta. the 11 counties that make up the greater Atlanta area. And it's had 46.8% of all of its listings have at least one or more reductions. These are active listings that have had reductions. And it's been reduced by an average of 6.1%. That's not an insignificant number.
On a million-doll house, it's at least $61,000, right? 30,000 on a $500,000 house. Now, when you look at the different counties, DeKalb County has had more than half of all of its listings have one or more price reductions, and it's also had the highest reduction average at 8.1%. That's a lot higher than everything else. I mean, you can see right here that it typically ranges from on the low end 4.8 all the way up to 8.1 in DeKalb.
The next highest place that that's had a good amount of reduction is in Fulton County. The average listing that's been reduced there was reduced by 6.8%. Now, where are these reductions concentrated price-wise? Let's look at that right now.
Reductions by bracket 2:22
So, broken down, you can see that the lower end of the market, 1 to 200,000, those are going to be mostly condos and town homes, some single family homes, and then 2 to 300,000. These two brackets, over half of all of its listings have had a reduction. That's a little counterintuitive when you think about it because you would think that the more affordable the home, the higher the demand. But I think that also you have sellers that are trying to price these houses way higher than what the people in these brackets are prepared to pay for them, you know.
So 11.8% is just off the charts in terms of reductions of properties that are between 1 and 200,000. 7.9% is not insignificant either. This month we're going to look at a couple of heat maps that I've created. So, let's take a look at the zip codes to see where the highest concentration of reductions are happening. And I'm going to zoom in so that you can take a quick look. But is it any surprise that 30032 has the highest concentration of price reductions?
That's Decatur. We just got done talking about DeKalb having some of the highest number of price reductions in the entire metro area. Well, in town, you don't have quite as much in some of these areas as on the outskirts. Take a look at what's happening out here in suburbia. You know, so there's a lot of price reductions happening in a lot of different parts of metro Atlanta. What's driving it? Well, we talked about home sellers pricing their homes too high.
That's definitely one of the main factors. The other one is an overabundance of supply. So, when we take a look at this, we're currently sitting at 21,941 active listings. That's almost 22,000 listings. The last time we had this much inventory on the market was 2012. It's over a decade ago. Just three and a half years ago, there were only 5,600 houses on the market. Inventory was really tight. There were multiple offers on everything.
I mean, we all remember that. It's part of what got us into this mess with driving up prices to where they are because there just wasn't enough to buy. Not to mention all the hedge funds that came in and bought a quarter of all of our houses here. But that's a different story for a different day.
Active Homes 4:25
Today, we're sitting at almost 22,000 properties. So, you definitely have a lot of choice. And because you have a lot of choice, you don't have to as a buyer go into multiple offer scenarios in most of the city. Now, there are parts of the city that we'll see that are very, very competitive. But now with all of this inventory in the market, you don't have quite as much demand for the amount of supply, which helps to explain why we've had the same median sales price since September of last year.
We're at 425 right now. That 425 is what I talk about every single month. We're always at 425. The market feels stable, but it's really not when you peel back the layers, which we're going to do in this video. If you go back to July of last year, it was 424. Now, this is the rolling 12 set of data, meaning we're using 12 pieces of data to get to that median price, it smooths out the seasonality and the cyclical nature of the market, right?
Median Price 5:19
So, if you were to remove that and look at it from a monthto-month basis, it's up down up down up down. But as a whole, we're looking at fi 425.
Median vs Average Price 5:28
Now, the average price is right at around 530, 531. It's also been close to this price over the last couple months. As you can see here, some up, some down, but not a whole lot on the average. Usually, you see a little bit more movement on average because of the outliers selling big expensive properties, cheaper properties. They can move that a little bit more. Median is right at the middle of the market.
It's that 50% mark. If you think I'm doing a good job with this video, or at least you appreciate the time it's taken to compile all of this data, hit that like button. Consider subscribing if you haven't. We'd love to see you on the next video. So, how does this median price breakdown over the metro area? So, on this chart, this red dotted line is that 425. So, you can compare how these different counties are doing relative to how the metroplex is doing, right?
So Atlanta 425 445 is the median price for single family homes, 392 for town homes and 300,000 for condos.
Greater Atlanta Area Prices 6:22
So when you look at this map, there are some areas that are appreciating year-over-year and there are some areas that are starting to depreciate. Starting with Gwinnett, there's no movement at all this past month. So for the month of July year-over-year, the price is still $429. Now where it is appreciating is in Cobb, Cherokee, and Forsyth. So Cherokee is up 2.5% at 492. Forsyth is now up to 629 and a half at 2.3% appreciation year-over-year and Cobb moved up just a little bit at a half percent.
It'll be interesting to see. I think that that might uh end up being where Gwinnett is in the next couple of months. Now, everything else is starting to see downward movement sometimes just very incrementally. So, Paulding and Douglas are some good examples of that. They're down.3 and 2% right negligible. Fulton's down just a hair over a half percent. Then you've got a little bit more movement in DeKalb. So down 1.9%. Median price there now is 368.
In Fate we're down 1.1. Clayton's down 1.3 and Rockdale's down 4.8. So you get some of the more affordable real estate in metro Atlanta is in Clayton, Rockdale, and Douglas. And they're all seeing lower movement on prices as well.
Median Price by Type 7:38
Now, broken down by county and by type of property, we'll see here that in metro Atlanta, we've already talked about 425 being the median overall price, but for single family homes, it's 445. Town homes is 392 and condos, the median price condo in metro is 300,000. So, with nearly 22,000 active properties on the market, when some of those properties go off market because they're going under contract or they they're a failed listing, they get withdrawn, you always have new properties that have to come to market to replenish that.
New Listings 8:08
This here shows those trend lines. So, the yellow line is what's happening this year. The obviously the other lines are previous years, but the light blue line is compared to last year. So you can see that this year, every single month, we've been above what's happened last year in terms of new inventory coming to market. That's no different from the month of July. You can see the difference here. 8,300 for this month and um or this year.
And last year it was 7978.
Active Listings 8:34
Now, let's take a look at active listings because the story is starting to change. So what do I mean by that? Well, in my last couple of videos, I was talking about how the gap between 24 and 25 was starting to widen. Now, in July, that story is changing a little bit because check this out. Now, there is an upward slope here. This year, this month compared to last month, there's roughly 190 more active listings than there were in the month of June.
But that's kind of flat. Whereas, when you take a look at 2024, this is an upward trajectory the whole way through. So, it's going to be interesting to see. Are we going to continue with a flat trajectory? Is it going to break upwards or is it going to break downwards? It's going to break downwards at some point. When you take a look at previous years, it's pretty much in the month of October.
Do we get there a little bit earlier this year? It's going to depend on new listings coming to market versus what's exiting the market with pendings and closings. Now, let's take a look at where these active listings are concentrated in metro Atlanta.
Heatmap of Actives 9:34
So, taking a look at this heat map, we can see where these listings are concentrated. Now, there are 427 listings in 30318. It's basically westside, upper west side, that area. Now, where there aren't a ton of listings, you take a look at Buckhead, Broke Haven, etc. Like these areas just don't have as many listings. You take a look at uh for example, East Cob, not a ton of listings. Sandy Springs, not a ton of listings.
Uh parts of Roswell, right? Uh where you do have a lot of listings. It's interesting. Some parts of Alpharetta don't have a bunch and then one zip code over there's a bunch. Coming there's a bunch. Take a look at Canton. Uh to the west of the city, Paulding County. They're building a lot of new construction in Paulding right now. That's fueling a lot of inventory. This is Douglasville. This So you can see the suburbs have a lot of active inventory.
There are pockets closer to the perimeter and inside the perimeter that don't have a whole bunch.
Pending Listings 10:32
So that's active inventory. But let's take a look at what's happening in the market with pendings. Properties go under contract. Now, I think that this is interesting. I think that there's some optimism here. So, in June, I was wondering where would this break? Would it break up? Would it break downwards? Would it stay even? And ultimately, what it did is it pretty much stayed even. Now, that's good because when you take a look at the last two years, there's a clear downward trend there.
Now, 2022 is an outlier. We still had three three and a half% interest rates in 2022, but these last two years at this point, you saw pendings basically trending down. Well, what can explain that? Well, the start of the school year is one, right? Because a lot of people need to be in their new homes before school starts. But this year, it's remained flat. Where it hasn't remained flat, unfortunately, is with the number of closings.
Sold Listings 11:18
That's 400 and change less closings in the month of July than there were in the month of June. Now, I just got done talking about the school cycle, so that could be a factor. When you take a look at the last two years, there's some mix mixed signals here because you go back to last year and closings actually trended up at this point. So, was it a rush of people trying to get into their houses before school started?
That's a possibility. Uh, but this year it's down relative to last year.
Heatmaps of Sales 11:48
So, now this is an interesting one because for a county as big as Fulton is, it did not have the most sales for single family homes. Gwinnett did. Gwinnett had 783 compared to Fulton 778. Next, I'm going to show you town homes. You can see how the colors will change and where the distribution of town home sales are concentrated. So, take a look at that. So, Fulton has more town home sales than anywhere else, right?
157 of them compared to 105 in Cobb, 98 in Gwinnett's, and 81 in DeKalb condos. Fulton. So, while Fulton didn't have the most single family home sales, it did have the most attached properties with town homes and condos. So, here's a heat map of where properties are actually closing. Now, of course, the northern suburbs are going to have a lot. That's where most of the listings are. We saw that on the other chart in town.
There are less listings, so of course less are going to close. So, it goes without saying. Now, when you look at areas like Woodstock and you take a look at the different Alpharetta zips, Johns Creek, Suwanee, uh there's a bunch of activity that's happening in those areas with actual closings.
Actives vs Sales 12:55
So, this chart right here puts into perspective everything that's happening right now in metro. It's that impactful. Let me show you exactly what I mean. It's one of my favorite charts in this deck. 5 years ago, in the month of July, there was practically a 1:1 ratio between active listings and closings happening in that month. If you go back to the month of May, this was almost an exact 1:1 ratio. Now, there's a gap here, right?
It's a bigger gap in July of 2025. If you go back to June, just this past month when I did the video uh last month, the gap was a 5:1 ratio almost perfectly. It was 21,700 active listings over 4,38 closings somewhere around there. Now in July that gap has widened even more. We're at 5.6 to1. So what happens then in the future months if this line continues to trend upwards at that pace and closings continue to trend downwards and this gap here between activives and closings continues to widen.
It's opportunity. It's opportunity for buyers. A lot of opportunities. Everything that's going to follow this is going to be more advantageous for buyers. So, if you're in the market or you're about to be, things are about to become very interesting because you're going to see, we talked about price reductions. There are a lot of them. You're going to see more of those. You're going to probably see bigger price reductions. Uh you're going to have sellers who are going to sit on the market.
We're going to look at failed listings here in a little bit, but you're going to have more sellers exiting the market because they're not getting the price that they want. or if they have to sell, they're going to have to sell at a price that's going to cause the property to actually be purchased, and that's going to be more opportunities for buyers to get better prices. You're going to see concessions go up, and we're going to cover all of that in the video coming up.
I've got data on all of this to share with you. But the wider that this gap gets, the higher that this ratio gets, the better it is for buyers in our market. Now, that doesn't change the fact that interest rates remain high. I've got a slide. We're going to cover interest rates in this video as well, and it makes affordability tougher for buyers. But if you're able to get properties at a cheaper price, and if rates one day end up coming down, you could refinance.
Now, I'm not the biggest advocate of date the rate, marry the house, because what happens if you buy a house, you overextend yourself, and that rate never comes down. I think you have to be comfortable buying the house at what your rate is. And if it happens to come down in the future and you have an opportunity to refinance, great. You'll save even more money. But you have to be comfortable with whatever that payment is.
And that payment's tough. It's tough in all of these different price ranges because it's a lot higher than what it was just 4 to 5 years ago. But if you're in the market or you're about to be, this is really exciting stuff. Like we haven't buyers haven't really had a reason to be excited since interest rates were low a couple years ago. So, I'm glad to see that there's some opportunities that are starting to present themselves in the marketplace.
Mortgage Rates 15:58
So, let's take a quick look at rates. Now, we ended the month of July at 6.72%. That was the average 30-year conventional rate according to Freddy Mack. Now, over the last couple years, right, you take a look at the 2020s and 2021s, the rates were lower, so the sales were higher. Rates shot up basically in 22 and 23, hitting 8.03% in October of 23 and shortly thereafter we saw basically a new low for sales and then they've stayed between 6 and 7 really for the last couple years.
So low in sales back up a little bit. Now they're trending back down but rates have been relatively stable. So when exactly are rates going to come down because they've been moving sideways here for a number of years between six and seven and people some people can but a lot of people are on the sidelines they can't afford buying a house at today's prices at these interest rates. So what happens if rates come down right they come down into the fives 5 and a halfs.
What that's going to do a lot of the buyers who are on the sidelines waiting for that to happen come back into the marketplace. Well that's going to put pressure on supply. those 22,000 homes are going to shrink. There's going to be more demand. And what's likely to happen is that home prices are actually going to go up. At some point, they're going to rise so much that it's going to outweigh the benefits of the lower interest rates.
But right now, the interest rates aren't low anyways, right? And if you listen to the media, all of this is depending on what the Fed does, the Federal Reserve. And this past month in the month of July, they decided to keep the rates exactly where they are, unchanged. But I would tell you that it's there's a bigger correlation to what happens with the 30-year mortgage rate uh when you look at the 10-year Treasury than what the Fed does with the Fed fund rate.
You can take a look at it right here. So, you know, pre202 there, that correlation wasn't exact. Rates shot up quite a bit here, and that's what the orange line is. But look how over the last year or two it became a lock step with the 10-year Treasury. Now when the 10-year Treasury goes up, interest rates go up. When the Tre 10-year Treasury comes down, interest rates come down. And the 10-year Treasury will always move first.
So when you see the 10-year Treasury move down in the weeks after, sometimes days, mortgage rates trend down. So when the stock market is really, really good, unfortunately, the 10-year Treasury goes up. So, you would also need something to happen to the stock market for prices to recalibrate, for that 10-year Treasury to come down, for interest rates to come down. But it's really tough when you think about it because with your 401, nobody wants to see their 401k tank.
You know, that's your retirement. You want that to be as high as possible. You might not need it today, though. But if you're about to retire, sure. But you want rates to be better today. The only way that rates are going to come down is if there's a correction in the stock market. You can't have both. And the 10-year Treasury tends to follow the stock market and the mortgage rates follow the 10-year Treasury.
So, in order to get the lower rates, you have to see a correction somewhere with the stock market. So, that's going to be one of the signs. When you see that happen, then you look at the 10-year Treasury and then you could potentially forecast that the mortgage rates will come down.
Months of Supply by Type 19:20
So, are we in a buyer market or a sellers market? Okay. So, this yellow line that I've created here is no man's land. It's a balanced market. So, there's no advantage to the buyer or the seller. It's a more equitable market. Think like 2018, 2019 back in that market, right? You got some off the price of the house. Seller paid closing costs in most cases. They were open to repairs and it was still a win-win.
Sellers were still happy with what they were getting. It's not the 2021, 22, 23 sort of market. So, when you're between 5 and 6 months of inventory, that's that balanced market. Anything above this red line is now buyer market territory. When you get above six months, you're basically in a zone that tends to favor the buyer in negotiating. Now, anything under that five-month mark is a sellers market. And the advantage goes to the seller in negotiations.
Now, it doesn't feel like it's a sellers market, even though it clearly is when you look at the data because we've been so spoiled over the last couple years. And I know that I've said this in the last couple of videos, but it's true. A lot of sellers got used to selling their houses in minutes, hours, and and you know, so there's when you start to spend a little bit more time on the market, you start to worry whether or not you're going to be able to sell your house in the time frame that you were expecting or for the amount of money that you needed to be able to move on with your life.
And suddenly you think that it's a buyer market, but it's not. When you take a look here, the only places that we have buyers market right now are in the condo markets, and it's basically greater Atlanta, and it's specifically in Fulton where there's 6.8 months of inventory for condos. Now, you've got some um you know, the overall market in in Fulton is almost there, but you can see that that's not single family and it's not town homes.
It's driven largely by the condo market. Now, it's the same thing when you look at DeKalb. you know, DeKalb uh attached properties as a whole are in balance or trending towards balance, but single family and many other parts of metro Atlanta are still firmly in seller markets. Now, again, it's hyper local. It depends on school district, what zip code, what part of town, etc. Like, there's a lot to it, but when you take a look at Cobb, for example, there's only 2.8 months of inventory.
That's a super strong sellers market. So, you're still seeing multiple offers in different like the some of the better school districts. Uh, if the property is in great shape and it comes to market and it's well priced, it's getting a bunch of offers. Cherokee 3.1 3.1 over in Gwinnett. So, those are strong seller markets still.
Heatmap of Months of Supply 21:57
So, here's a heat map. The darker colors are where there's more supply. So, the lighter colors are predominantly going to be seller markets. The darker blues are going to be either trending towards balance or they're in buyer markets. So, we're going to zoom in a little bit so you can see this a little bit better. Uh, but this is look at some of these in town zips. So, 6.89 and this is everything.
It's not just condos. It is that's the nice thing is when you drill down into the specific data and you peel back those layers, you can really see what's happening in these little micro markets, the hyper local part of real estate, right? as opposed to county as a whole, especially when you look at a county that's as big as Fulton. We talked about that a little bit earlier. So, I'm nerding out when I look at this stuff, but take a look at that.
30326, 8.5 months of inventory across all its inventory. That's a huge buyer market right there, right? So, I was talking about Cobb, uh, for example, not being in one. And when you take a look at some of these zips, you know, whether it's West Cobb, I mean, look at that. Two months of inventory. This is uh Marietta Square 360308 just south of the square. Uh East Cobb very strong sellers market. This is Roswell.
Look at that. 1.87 months of inventory. So you know you look at Johns Creek and Suwanee and parts of Alpharetta sell uh sellers market sellers market sellers market. Hyum of all places 1.88 months of inventory. Uh you got well-priced houses. They're relatively uh well accessed with Highway 278. So, seems like properties are moving interestingly quickly on that side.
Days on Market 23:38
So, let's take a look at how long it's taking to attract a buyer to go under contract. And we're looking at cumulative days. So, if a property is under contract and it goes back to market, it's the total overall marketing time to go under contract for the last time. Now, it's 54 days on average for metro Atlanta and for single family, it's 51 days. We got done talking about Cobb being a really strong sellers market with 2.8 months of inventory, but it's at 43 days.
So, I mean, you can kind of understand how somebody might think that the market has shifted quite a bit now. It has. This this is um over the last couple years, this days on market has trended up quite a bit. There's no question. But at 43 days, it's taking a month and a half on average to find a buyer. I think it's time for sellers to just temper their expectations a little bit and it's going to take a little bit longer to sell.
But don't panic. You know, if you're priced well, buyers are still buying in the market. It's just taking a little bit of time. It's you've got to worry if you're overpriced. If you're overpriced, you're going to have to go through a cycle or more of price reductions before you hit that right price. So, at 43 days, that's one of the lowest for single family in the entire metro. You know, you take a look at Fulton.
Fulton's at 53 days tends to follow greater Atlanta because of how big and how much volume they've got. But take a look at the condo market. 82 days on market for condos in Forsyth. I don't know that Forsyth has a ton of condos, but Fulton is a county that has a bunch of condos and they're at 76 days on market.
Heatmaps of Days on Market 25:12
So, real quick, we're not going to spend a ton of time on these next two heat maps, but I want to show you basically where the concentration of highest days on market are for active versus the properties that actually sold. So, take a look at where this is and I'm going to click next here so you can kind of see where it shifts to for the highest days on market for the properties that actually sold because it does differ.
Check this out. So, see that I'm going to go back and forth. So active salt, active salt. Interesting, right? So you've got some areas that are going to be deep blue no matter what. But take a look at that Waleska area. That's Lake Arrowhead up in Cherokee County. And for the properties that actually sold up there, they spent an average of 119 days on the market before they sold. You know, you take a look a little bit uh closer.
Look at 30314. It's 135 and a half days, call it 136 days on average to find a buyer and close. Like that's a significant amount of market exposure to find a buyer in some of these parts of town.
Failed Listings 26:23
So, let's take a look at failed listings. And you'll see that pretty much across the board, failed listings are up. And big reason for that is you have a lot of home sellers right now who when they're not getting their price, they're taking their house off the market. They're saying to hell with it or they go through their contract period, they didn't get their price and are allowing their properties to expire.
And some are coming back to market, but some are not. Nonetheless, these are failed listings, total withdrawn and expired listings. And while it might be the same month over month, it's up significantly year-over-year. There are a thousand more failed listings this year than there were last year in the month of July. And when you see how it breaks down by the counties, it's pretty incremental everywhere. You know, it's it's uh it's roughly the same ratio of increased failed listings everywhere.
So, what that tells me is that people are unrealistically pricing their properties everywhere in metro Atlanta.
Will the market crash? 27:27
So, I've got a question and you might have the same question, too. And if we've got all these price cuts and active inventories up, but closings are down, pendings are flat or down, months of supplies ticking up, days on markets ticking up, interest rates still suck, home affordability is still a challenge, like are we headed towards a crash? And depending on who you listen to, there are a lot of people out there who are adamant that this market's going to crash.
And that's where I'd like to remind everybody that real estate is hyper local. And just because you might see other parts of the US struggling like you look at Texas and Florida and those markets are really starting to struggle. Take a look at the Northeast and those markets are thriving right now. They're huge seller markets here in Georgia specifically and closer to home in metro Atlanta. I've got some data that I can share about what's happening with foreclosures and we're going to start with a thousand foot view.
We're going to look at the US as a whole. We're going to quickly look at Georgia. Then we're going to look at one of the most important counties in metro Atlanta. We'll look at Fulton. And you'll see here that I don't think that the market is going to crash. I don't even think that we're going to have a large correction. I do think we're going to get better pricing. And that's long overdue.
And it is a correction, but it's not a crash. And here's why. So, here's what we're going to do. We're going to look at foreclosure filings on one hand, and we're going to compare that to foreclosure completions. Now, a little caveat. Just because a filing happened doesn't mean that that ends in foreclosure. And there's also, and it varies by state and jurisdiction, wildly different lead times to go from filing to completion.
Some take months, weeks, others can take multiple years.
Foreclosure Data 29:12
It really depends on the state. So for the USA, there were roughly 140,000 uh filings yearto date. And 15% of those ended in completions. Roughly 21,000 homes were taken from the homeowners and given back to the banks. When you take a look at Georgia, it's 12.3%. So 4369 properties had foreclosure filings filed against them year-to date. And of those, 538 ended in foreclosure. Now, when you zero in to metro Atlanta, this kind of shows you why I don't think we're headed towards a crash.
But in Fulton County, there were only 5.6% of the filings that ended in foreclosure. So year to date, there were 393 filings and only 22 of those for the entire first half of the year turned into a foreclosure. When you consider the total amount of properties, households, household units in metro Atlanta as a whole, 22 is a very, very small percentage of the market. So for perspective, in 2025, it's roughly 1 out of 4,400 housing units receive a foreclosure filing.
You go back to 2007, 8, 9, 10, and it was 1 out of 45. So 22 houses went into foreclosure. That's really tough. You know, a lot of people if they bought over the last couple years, uh, they can sell, they've got equity. They don't need to let that house go back into foreclosure. Sometimes you bought and you don't have a choice and it goes into foreclosure, but it's 22.
Showing Activity 30:45
The market is relatively strong. So, now we're going to take a look at showing activity. And showing activity is a great great metric to look at for overall market health because it's one thing to see closings and pendings going down, but if you're seeing buyers withdraw from the market and showings going down as well, that's super scary. Now, that's not the case. In many parts of metro Atlanta, you're going to see that this year there are more showings than last year.
Now, part of that is when there are more homes to choose from, buyers are going to go and look at more. They know they've got more time, right? Properties aren't going under contract as quickly. They don't feel rushed. So, instead of looking at three to five houses and making an offer on the one that they really want, they're looking at 10, 12, 15, 20, sometimes a lot more. Nonetheless, showings in many parts of metro Atlanta are up.
So, for metro Atlanta as a whole, they're up 5.6% year-over-year. And you can kind of see where that's broken down by price range. Pretty much in every single price range, they're up with the exception of 6 to 700,000. Uh there are less showings this year than there are last year, but everywhere else there are more showings this year than last year. Now, broken down by county, starting with Cherokee, uh Cherokee has a couple of price ranges that are down, but when you take a look year-over-year, the county as a whole has 5% more showings this year than last.
You take a look at Cobb, it's up almost 10%. That's a lot of extra showings. And there are a bunch of extra showings happening between five and 800,000. Just that those are segments of the market that are very, very busy right now. Now, take a look at the year-over-year showing increase for DECAP. It's up 15.2%. With a lot of that happening in the lower end of the market between two and 400,000.
So, big big increases in DeKalb. Next, we've got Douglas. So, things are down in Douglas, but they're also down in Forsyth County. They're down 7% year-over-year in Forsyth. So when you take a look at that five to 600, look at that big drop, which is interesting because you look at six to seven and it's up, then it's down, and then it's up. So like what's happening there? Part of it is builders building in very specific price ranges.
And where they had previously started because prices went up, those got pushed into the next bracket. And that's where the showings are happening. So then we've got Fulton, and Fulton's up 3.7%. Uh there's some increases, some decreases, but like similar to DeKalb, that's a big jump on the lower end of the market. And then that brings us to Gwinnett. So Gwinnett is up just a hair 1% year-over-year. You take a look here, it's practically the same thing everywhere.
3 to 500 almost is the same thing. And then 5 to six, there's a marginal increase.
Sales Price to Original List Price 33:33
So at the beginning of the video, we focused on price reductions on active inventory. And there's a lot of them. Half of all of the listings have slashed their prices anywhere from 4 and a half all the way up to 8.1%. Big, big price reductions. What we're going to focus on now on the back part of this video is what actually sold and the deals people actually got when they closed on their properties.
We're going to start looking at that with sales price over the original asking price. Now, for Metro Atlanta as a whole, it's 96.3%. It's roughly the exact same thing for single family for Metro Atlanta. So on the properties that sold 96.3 it's almost 4% off the asking. So active listings, they're active with price reductions and still on the market for a reason. They were overpriced to begin with. The properties that are influencing the numbers that you see here, they came to market.
They were priced appropriately and they sold. So I've got some data on the number of properties that sold at asking. There are still properties that are selling for more than asking. We're going to look at that here in just a moment, but there's a growing number of properties that are selling for less in asking. So, on average, sellers are selling for 3.7% under their original asking prices. Now, of course, it's region and property type specific, and that's what this chart shows.
So, town homes in Woodstock, for example, there are a lot of town homes in Woodstock. They continue to build a bunch of town homes in Woodstock, and people continue to buy them. And when sellers go to resell them, they're getting 98.1% of the original asking price. So, it's a very popular segment of the market. When you take a look at DeKalb for condos, you can get a deal on a condo in DeKalb.
Right now, they're selling for 5.3% off the original asking price on average, but you can also get a deal on single family in DeKalb as well. It's just 95.8% for single family there as well. So this right here helps to validate that the tides are turning in favor of the buyer. So let's see by how much.
Did Sellers Get Their Price? 35:38
So there are more and more sellers that are selling their properties for less than asking. As a matter of fact, two out of every three properties that sell in metro Atlanta sell for less than the asking price. At asking, one out of five homes that come to market are getting their price. So there are properties that price well. they're in right condition, right location, right time, and they sell for their asking price.
And then 13% sell for above asking. So, multiple offers. Uh this is really in some of those areas with really low months of supply and low days on market. So, parts of Cobb County, parts of North Fulton, they're experiencing still these multiple offer scenarios when the property comes to market and it's in really great shape. Parts of Brookhaven. So, there are those little pockets. Again, real estate is hyper local. But that's interesting, right?
Because just a year before it was 20%, that's a 7% drop in one year. So, while there are still multiple offer scenarios, they're definitely not quite as prevalent as they were in previous years. So, what about concessions? How many sellers paid some form of closing cost? Because over the last couple years, if you didn't pay your closing costs, well, you weren't getting the house. sellers were flat out refusing to pay them because they had plenty of buyers who were willing to pay their own closing costs.
Concessions paid by Sellers 36:57
So, when you take a look at it this year, we've got 67% of all homes that sold sold with the seller paying some kind of concession to the buyer towards the closing costs, up from 61% a year earlier. So, that's a big shift. Going to head back to this slide here. And the average concession that's paid across metro Atlanta is $8,300. That's a big jump year-over-year. You're looking at $1,200 more dollars paid towards closing costs this year compared to last year.
Areas with Most Concessions 37:27
So, sellers are paying a ton more in closing costs. That's great. But where exactly are they paying these closing costs? Well, I've got a heat map that'll show you exactly that. And the most closing costs right now being paid in metro Atlanta, they're being paid in the Walton High School district in East Cobb. That's 30068. So $13,000 on average is what sellers are paying there in order to get a transaction done.
When you take a look at some other hot areas, you've got 30548 that's Hoschton. There's a lot of new construction happening up that way along 85 and like Twin Lakes for example. There's a bunch of other neighborhoods, but they are building hundreds if not thousands of homes up that way and they've kind of overbuilt. And so like these builders are getting desperate in a way. They're offering more and more incentives. Closing costs are one of them.
So if you want to live out that way, you can get some pretty good incentives out if you're going to go to uh Hoschton, Braselton, you know, Jefferson, all those areas. So it's a little bit further out. Uh but good incentives. This down here, 30268 is Serenbe. So if you've ever been to Serenbe, it's a special little place. Tons of incentives, lots of new construction there as well.
Link to Next Video 38:44
So, it goes without saying if you can get concessions like these in places like East Cobb and in Saren, you can probably get a better deal in those houses as well. So, if you're curious what you can get in the upper end of the market, I'm talking about million-dollar plus, you definitely want to watch this video next. It's a whole video dedicated to the Atlanta luxury

About Terence Richardson
Terence Richardson is a Realtor with Compass and the founder of the Terence Richardson Group, which serves Metro Atlanta. He publishes Atlanta’s Housing Market Update every month on YouTube and in The Richardson Report.
