Plays here from YouTube when you press play. Open on YouTube
Published . Prices, rates and counts in this video were current on that date. This month's numbers are on Market Data.
What is this video about?
“Atlanta's Housing Market Update (February 2026)” is a 1 hour 5 minute video by Terence Richardson, a Realtor with Compass in Metro Atlanta. It was published on February 17, 2026 on his YouTube channel, Terence Richardson - Atlanta Real Estate.
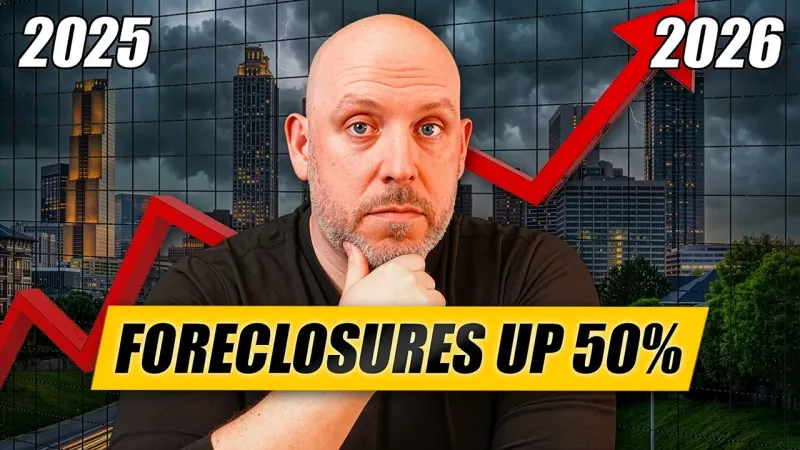
Foreclosures are up 50% in Greater Atlanta and January had the fewest closings since 2011. Are we on the brink of a real estate crash in metro Atlanta? That and more in this month's edition of Atlanta's Housing Market Update!
Transcript
This is the caption file published with the video, set into paragraphs. Place names the captions misspelled were corrected. 17 figures or words the captions misheard were corrected after checking them against the video’s script or a second transcription. Nothing else was added or reworded. Captions can still mishear a word or a number, so check a figure against the video before you rely on it. Captions read November 16, 2026.
Atlanta's Housing Market Update - February 2026 0:00
Fore foreclosures are up nearly 50% in the greater Atlanta area year-over-year. And at the same time, in January, we had the least amount of closings in 15 years. That begs the question, is Atlanta headed towards a real estate crash? That and more coming up in this month's edition of Atlanta's housing market update.
Foreclosure on the rise 0:21
Let's jump right into it. So, a 50% rise in foreclosures is a headline that is going to grab attention. There's no question. kind of feel that to a certain extent it's a little clickbay especially when you understand the underlying numbers but it's not technically false 50% I said nearly because really that number is closer to 48%. When you take a look at what's happening in the media you're starting to see more and more articles come out and or messages that are happening on the news and so forth citing the increase in foreclosures year-over-year.
This is the latest one from Housing Wire. They're talking about a 32% increase in filings year-over-year. Now, a filing doesn't necessarily mean that because a foreclosure was started that it's going to complete. And there is a big difference here. But when we take a look here at Atlanta, the actual numbers, these are based on actual closings. So, we're going to take a look at this right now. So, foreclosures and short sales make up total distressed properties, right?
And if you take a look at the 12-month period and you look at all of the closings between February 2024 and you add all of them up through January of last year, 0.624% of those closings were foreclosures. Not even a percent, right? Short sales were even less. 0.05% of the market made up short sales. Now, what's the difference between a foreclosure and a short sale? Well, a foreclosure is a property that the bank has taken back and it becomes a real estate owned.
It's on their books. And that's the foreclosure in the traditional sense of what people think when they hear about foreclosures. It's really called real estate owned. Short sales is homeowner owes more on the property than what it can sell for, right? The mortgage, they're upside down in the mortgage basically. We did a lot of short sales in the past 10 to 15 years, but there haven't been a whole lot over the last five because of where appreciation's gone.
But now we're starting to see a comeback with short celles. If you bought a house over the past year or two and you didn't buy in the right part of town, um, unfortunately, in some cases, you might be upside down, especially when you take into consideration selling fees. And it's not I think a lot of people got used to the double digit appreciation from 2020 to really 2023. You'd buy a house and a year or two later it was worth significantly more.
It's not like that. In a healthy market, you're seeing three to four, sometimes 5% appreciation. We were at double appreciation for quite some time. And now there's a little bit of a pullback in different parts of the market. So, we're going to cover that in this video. But short sales, you're working with the bank to get permission to sell the house for less than what's owed. You typically have to have a financial hardship to qualify and or if you move more than a 100 miles away from the house for workrelated reasons and you can show that you have an offer letter and a job in a different state for example or a city that's more than 100 miles away.
Sometimes the banks will approve those as well. Nonetheless, it's a very very small part of the market right now at 0.052%. Now total it's 0.676%. So 23% right? So, when you take a look at that and you compare it to the most recent 12-month period, those numbers went up. So, from February 2025 through January of this year, foreclosures were almost 1%. They were 0.91%. That's up roughly 48%. That's where that stat comes from.
So, you look at it, oh my gosh, foreclosures are up 50%, right? But that's less than 1% of everything that's closing in that given month. So, we're going to dive into that. We're going to dissect all of it. Short sales, they've increased as well. They've almost doubled when you take a look at that from 0.52 in the previous year to 0.09%. But together, you take a look at foreclosures and short sales, they were making up 2/3 of a percent uh you know, in the year preceding this past one.
And now these past 12 months, they're up to 1%. So, let's keep looking at that because actually, as of today, they're even higher. So, there is an upward trend. Over the past 12 months, there have been 52,712 closings in metro Atlanta for the greater Atlanta area. It's basically 11 counties that are a part of the FMLS data set. Okay. So, there are counties in here that have had activity and we're not counting them.
And those are like for example, Coweta, Henry, Hall County, Barrow, Jackson. Um, you know, there's there's a lot of those perimeter counties that are not included in this. Bartow, Carol, etc. like Dawson, you know. Uh but for the 11 county area, it's 52,712. And of those closings, 482 were bank foreclosures. And then this little dot that you see here, those 46, well, those were the short sales. So, it's a very small part of the market.
And when you see where the REO, the foreclosures were concentrated, you can see which counties had the most of them. So, no surprise that you had most of them in Fulton County, Cobb County, Gwinnett, these two counties are very similar in terms of real estate activity. Uh, so it's no surprise that they're neck. DeKalb is the next county that's quite big, but only 30 here. And you've got to go outside of those core four to see that Clayton actually had a surprisingly higher number.
In the grand scheme of things, these are still very, very small numbers, but uh it's it's still noteworthy. So, this is a snapshot of January 2026. So, are we heading towards a crash? Well, this is an indicator that we can look and see. And overall, there's 16,410 active listings. Of the listings that are on the market currently, 177 of those active listings are the bank foreclosures, the REO, 84 are currently short sales, and that combination makes up 1.59%.
So, in the previous 12 months, we were at 1%. Now, for the active properties, we're up to 1.59. And the ones that are under contract are a little bit higher. So, there are 2,703 properties that are currently pending as of January. And 42 are foreclosures, 22 are short sales, and that's 2.36% of the market. All right, the closings of it's going to match what was in January. That's 1%. So, ultimately, there's no question that distressed properties are on the rise.
you're going to see more short sales over the next couple of years as the market continues to correct because as we look into the data I don't think that we're headed towards a crash per se but there's no question that we've been in a correction here in metro Atlanta. As a reminder back in 2012 at the worst that's when the market hit bottom here in Atlanta 35% of all listings that closed were foreclosures.
That's one out of over one out of three, right? And then short sales made up about 10% of the market. 9% 1 out of 10 1 out of 11. So together that was 44 almost 45% of the market. In other words, one out of two properties, right, that came to market was distressed in some fashion. Now we're pretty much at 2% right now when you factor in the 2.36 and the 1.59, let's call it 2%.
So right now, one out of 50 properties that closes is a distressed property. And back then it was one out of two. So there's a lot of ground to cover in order to get back to that crash and I just don't see that happening. I think over the past couple of years we've had an abnormally low number of distressed properties because of the really high rates of appreciation that we've had in our market.
Right? If you lose your job and you go through the process to try and get a loan modification, maybe a deferment, like all those different options, foreclosure is the very very last thing that for most people will be on the table unless you're not educated about the process. You know, if you stay in your house and you're not making payments, then the bank eventually will foreclose on the property. The national average is 592 days after a filing happens, but that's because of states like Florida and uh New York and probably California where those timelines are longer.
Here in Georgia, it's a non-judicial state, so they don't technically have to take you to court to foreclose on the property. They go through a process of advertising in the paper with notices and they can start that process after a little while. So, they tend to happen faster, but still they're taking over a year here on average. So you have options, right? So for that's why we haven't seen a ton of foreclosures over the past couple years is because of the equity position people have had.
So rather than let the property go back to the bank, why not sell it and maximize the equity that you have in the property? Because if it goes back to the bank and they sell it, they're supposed to give you the spread between what's owed uh and you know, all all of the late fees and whatever that they keep uh and the foreclosure fees and all of that. But anything that's above that goes back to the homeowner.
but they don't have an incentive to maximize that sales price. So, hypothetically, if you get, you know, 500,000 for your house and you owe 300, the bank might put it on the market at 400 and give you what's left and you would have made a lot more by selling it on your own terms. So, I think you're going to see more short sales. There's no question that we're going to see more foreclosures.
I think it's healthy to have a certain percentage of the market be distressed nonetheless. I hate to say that, but you don't want to see anybody lose their homes. But if you are in a really tough situation and you don't make your payments, then the system that we have is going to take that house back eventually, right? But the good news is people have a lot of different recourse and a lot of different options before they ever allow the bank to take that back.
You just have to be aware with what they are. Maybe that's something that if the market continues to shift that way, might be worth doing some videos on this. Um, but I'm not seeing the market heading towards a crash. uh not based on this foreclosure data. So maybe because of some other factor.
Fewest closings since 2011 10:10
Let's keep moving through. So when we take a look at closings, we had the least number of closings in the month of January since 2011. That's 15 years. And we had 2696 closings. Okay. Back in 2011, the last time that there were fewer, uh you had 2,442. Now, this chart goes all the way back to 2007, which was the beginning of the great financial crisis. And you see where we were to start.
Obviously, those first couple years were a little dicey. Then the market hit bottom and then you had a steady flow as the market recovered heading into balance in the teen years and then the 2020 stuff happened. Market got really really crazy. A lot of closings and then here there was a big dip. What do you think caused that? Right. Interest rates shooting up. So, we printed unlimited money, more money than was ever printed in the history of the US.
And that caused a whole bunch of inflation. Caused interest rates to have to be brought way up to try and combat inflation. And as a result, closings dipped. But they still go they didn't go back down to 2011 levels. Uh but over the past couple years, they stabilized and now in January, they're down. So, what is the cause of that, right? Well, let's keep digging. So, as we move on, this is a chart uh it's a variation of a chart that I uh had in the market stat videos that I did during the summer.
And it shows the ratio between active listings and closings. And in the healthiest of markets, you know, you're looking at somewhere around a 4 to 5:1 ratio. That's a balanced market. And then when the market was overexuberant and take a look at 21 and 22 well these numbers were you'll see on the next slide almost at par. Now this is January in July they were one for one. So for every closing you had an active property.
For every active property you had a closing. So stuff was moving very very quickly. Now we're at a 6:1 ratio. So this 6:1 ratio sounds scary. Uh at the bottom of the market in 2012 it was a 7.4:1 ratio. So, there were a lot more active properties compared to the closings that were happening, a lot more inventory. But take a look at this. You know, is this necessarily going to keep doing this over the next couple years?
I think this year you're going to see a lot more inventory because I think there are a lot of people who've been sitting on the fence these past couple years with interest rates just not doing anything and now they're lower. They're lower this year than they were last year and they're lower this year than they were the year before. I've got all that coming up here. So, inventory in the next year and when we do this a year from now could have shot up quite a bit.
But there's also something else that could happen when you take a look at this. This could just be market normalization because when you take a look at 14 to like really 18 that was a very balanced market in 2019 and 2020. You started headed towards a sellers market and then things kind of paused as the health crisis started and then after that overexuberance, right? gross gross gross sellers market. But look, we're kind of back, these were years of balance.
That's kind of where inventory is right now. The challenge is that the closings are quite a bit less here. These numbers were closer to 32, 33, 34, 3,500 closings happening in January. Now we're at just a hair under 2,700. So So on this slide here, you see exactly what I'm talking about. at the peak of overexuberance, that's what I'm going to call that period of time. Uh we were at 1.3 to one in January, July of that year, it was one to one practically.
So that's tough because when you don't have a lot of inventory and you have all these closings, what typically happens to supply and demand? Well, demand's through the roof and supply is strained, so prices go up. And that's why we saw double-digit appreciation during that period of time. So, moving on, one thing that could potentially help these closings increase is home ownership affordability.
Housing affordability 14:22
So, that's what we're going to talk about next. So, I think that housing affordability is going to be a very hot topic over the next little while as we enter midterm. So, we're going to start covering an index that I put together that shows for the medianriced house, how much income is actually needed to be able to buy that house with 10% down. 10% is the closest average that we have here in Georgia.
Not everyone puts 20% down. Not everybody buys with FHA with three and a half percent down. The average is closer to it's like nine and change, but we'll we'll round that up to 10, right? So, the black bar or the black line on this chart is the median home price throughout time. The blue bar is basically the amount of income that you needed to qualify for that medianric house. The green bar is essentially the median household income at that point in time.
So, and and the red is obviously interest rates. So, let's take a look at this because if you go back to 2012, the medianric house was 127,000. Now, to own to be able to afford the medianric house, you needed $38,000, right? That's that's that's a bygone era because if you take a look at today, the median price has basically tripled from 127,000 all the way up to 445. Now, this is for the single family home.
Not looking at condos and town homes in this equation. When you look at the blended number for metro Atlanta, it's $421. But $445 is the median home price for single family homes. To be able to afford that, you actually need to make $100,000 more than you did back in 2012. That blows my mind. So, it's 138,000. So, how did we get from 38,000, which most single earners could afford a house back then, right?
You didn't have to you didn't have to be in a double household family with two people working to be able to afford the median price home or further along in your career more established making more money, right? Home ownership was available to a lot more people. Well, when we take a look, so wages stagnated for a while. They dipped a little bit during the health crisis. They've been on a steady rise since.
And over the years, when you take a look at where rates were during the what I call the balance years, 2014 to 2018, that wasn't necessarily a market that favored buyers or sellers. It was much more equitable. Rates hovered between four and 5% at that time. See, now look at what happened to home values during those years of balance. This here was a pretty steady incline. It was about 4 to 5% appreciation per year.
And that's healthy. That's what you want to see in the real estate market for average home price appreciation. Now, in 2020, after 2020, when things got into the overexuberant part of the market, look at the rate of appreciation. We went from four to 5% to double digit appreciation in many parts of Atlanta. And what caused that? Well, interest rates were lowered to try and jumpst start the economy. So that rolled into housing eventually because when you cut the Fed fund rate, it doesn't directly affect uh real estate, but the stock market's crashing and everything else is crashing, your 10-year Treasury, which we'll see on the next slide, goes down.
And that will affect interest rates for mortgages. And that's why we had rates in the twos and threes. But when you have rates in the twos and threes, home prices go way up because you have a lot of people that come into the market to buy. And also during that time in our market, hedge funds in the media, you'll hear that the big players, the Blackstones, Progress Residentials, Trons, whatever, the hedge funds that are buying up houses, they'll say, "Hey, well, they only own 5% of the market."
Well, before 2012, they owned significantly less than that. And then when they started buying the packages of foreclosures, they were buying 100 to 200 properties at a time. In Georgia, it's a lot more than just 5% of the market. They basically in 2024 were still buying one out of every four property that was closing that year. So, so you had cash that was putting a strain on inventory and then with interest rates being really, really low, most people who could afford to buy a house and and and want to take advantage of these rates were out buying houses.
So, what that basically pushed home prices up quite a bit. Now, what happened afterwards? Well, there's a whole ton of inflation because to jump start the economy, they printed trillions of dollars out of thin air and that caused a whole bunch of inflation. And the Fed's reaction was, well, let's raise interest rates. And they did. And they raised them significantly quickly. And then we saw mortgage rates go from 2.5% and they peaked all the way up to 8.03 in October of 2023.
So, when that happened, that's when our correction started. So you kind of see home values went up a little bit, but then they've been flat pretty much for the past uh two going on three years now. So ultimately this chart over the past couple of years 8.03% we're at 6.09% now. We've seen a downward trend with interest rates specifically over the last year and I'm going to talk about that more here in a moment that that's 7% down to 6%.
So, it doesn't feel like it because when you see everything around you, obviously home ownership, renting, whether you're buying or renting, whether you're buying food at the groceries, where whether you're keeping the lights on and paying your electric and utility bills, everything's more expensive. But technically speaking, you take a look at the income needed to qualify to buy the medianric house and the median household income. This gap is getting narrower, which means that affordability is starting to improve.
Now, back in 2012, when you'd buy a house, it was inversed, which meant that this was the most affordable time on record, honestly, a recent record. And for the past couple years, in the balance years that I was talking about earlier, see how the median household income kept up with the income needed to actually afford the medianric home. That was pretty much the definition of affordability. And it's really only during COVID, especially when the rates started to peak up, that you started to have a really big divergence there uh between what people actually made and what was actually needed to afford these homes.
So, the quickest path to increasing closings over the next couple years is finding a way to bring rates back down. Now, I don't think that we're going to see rates down into the twos or threes or potentially even fours anytime soon.
Mortgage-related insights 21:02
But when we go back to these rates, and I'm going to show you this on this next slide, you don't necessarily need them to be that uh low in order to restore home ownership affordability. You basically need them in the fives, mid to low fives preferably. And at some point, if they bounce between four and a half and five, five and a half, that's kind of where the market was the healthiest.
Now, another thing that would help home ownership affordability, of course, are home prices. And that's what you hear in the media. That's what you hear with, you know, obviously with the the politicians is they don't necessarily want to wreck people's equity because that's where a lot of people have uh they're using home ownership as a store of value and they have more locked in value than they've ever had in their homes.
But in order for affordability to be restored, interest rates are one, wages going up are another, but you're not going to have people magically double their incomes over the next couple years. So the most logical other option is to add more inventory. And you can do that by incentivizing builders to build more properties. And as supply increases and floods the market, you won't have a choice but to have home prices come down a bit.
So, it's the same thing if just it happens organically without incentivizing and more people choose to put their homes in the market because they've been on the fence uh about buying, right? So, you've always got people entering the market and exiting the market, buying versus renting, uh selling the house that they've owned for 30 years and then renting instead of buying something else. And there's there's an eb and flow to everything.
But right now, we're starting to see home ownership affordability trend in the right direction. So, not only are we not seeing the market heading towards a crash, but we're actually starting to see signs of the market improving here because like it or not, doesn't I know that for the crash bros out there, the people who've been hoping for 2007 to happen all over again, the underlying metrics that support the market just don't show that that's going to happen.
But, we've been in a correction. And that's why uh I think that now we're starting to see signs of potentially coming out of it. So, the 30-year mortgage a year ago in January was 7.04%. We're at 6.09. It's practically a whole point less. And for the median priced house, I'm going to show you exactly how much that means in savings on a monthly basis because homes have become more affordable by default uh at this time because of interest rates.
So, the red line at the bottom is the uh US 10-year Treasury, the bond market, and that's where the 30-year mortgage and the 15, they tend to follow the 10-year Treasury more than any other factor. And the 10-year Treasury likes to go up when the stock market's doing well and job indicators are coming in strong and the economy is strong. And it takes a hit when those things don't do well. So, but when it takes a hit, mortgage rates come down.
So, we've been flirting with 4% for quite some time. It's like it hits 4 3.99 and then it shoots back up and then every time it's getting close to four, you you've got these rates coming down, rates coming down, rates coming down, and then something happens. There's good news in the economy here, there, and then 10ear Treasury goes back up and the mortgage rates follow. So, but when you look at the overall trend year-over-year, we're still down a full percent on mortgage.
And compared to the pea in October of 2023, we're down 2% with what these rates are. So, what does that actually look like on paper? So, in January of 2025, uh, year ago at 7%, the median price home with 10% down, we're not looking at taxes and insurance in this example. We're only going to look at principal and interest, okay? And uh we're not going to factor in PMI because there's PMI too if you're putting less than 20% down.
But the payment on the median priced home uh at 7% was $2,665 a month. And now at 6% that same home is $2401. So it's a savings of about $264 a month or 31 $3,200 a year. So rates come down to 5% double those numbers. So you'd be looking at about $520, $530 a month in savings. And that opens up more of the market to more people because now people who are right on the cusp with debt to income ratios and being able to qualify to afford.
And qual qualifying and actually being able to afford a house are sometimes two very different things. But it's certainly going to open up a path to home ownership to more people as rates continue to trend down. Now, I'm not not uh the most um betting kind of guy out there. I'm not gonna put money behind it, but if I were to guess, I don't think rates are necessarily going to dip into the low to mid5s this year.
I think they're going to crest the high fives. Um I know for a fact, I've got clients that have closed on properties recently with rates in the five and three-quarters, 5.875, and that was without buying down points. Uh, so you're starting to see some, but the average rates are right at that 6.09. I could see where the average rates could get into like the five and three-quarters. And that means that for some people, they'll get 5 and a half, potentially even less without having to buy those down.
Um, builders right now have incentives where they're buying a permanent 30-year rate down to sometimes 3.99%. 4.99 is a lot more popular. So, new construction is very, very interesting. But ultimately, home ownership and home ownership affordability will be hot topics. And the good news is, even though it's just a little bit right now, starting to trend in the right direction. Here's another indicator that shows uh you know, optimism for the market.
So, when you take a look at this, you've got the 30-year mortgage here in gold or whatever that burnt orange color is. And this is from the mortgage uh news daily website. and they get their data from the mortgage bankers association, the MBA, uh which puts out a survey every week to see what's happening with mortgage applications. And here, year-over-year, basically beginning of the year to now, mortgage applications have been on the rise.
That that bodess well, right? Because what do you do before you go buy a house? Well, if you're smart, you're getting pre-qualified, pre-approved, and pre-underwritten ahead of time because if you're going to go shopping, you need to know how much money you've got in your wallet, right? And it's crazy to go out and look at houses if you haven't done this. It's a complete waste of time. Um, but so most people will shop for a mortgage ahead of time.
They get that letter and now they're going to enter the market. So, the fact that this number is so high right now is really, really exciting for the spring market. When you take a look over the past year, you know, this is 2026. We're already at a point that's higher than at any point over the past couple years. You got to go back to 2023 to see this many mortgage applications done in this uh week of period.
So, um I think that bodess well for spring market. I think uh I mean we were out this weekend looking at houses in North Atlanta, Roswell and Alpharetta and it seems like right now the market kind of sort of feels like 2021 with the amount of people who are out and multiple offers that we're seeing and gosh there's this one house that we saw that was beautiful and people had overbid it by 100,000 and I think I think to a certain extent that's a big mistake when you look at the underlying numbers be very careful
if you're out right now. Don't let your emotions get the best of you when you're making offers on properties because when you get caught up in a bidding war, a lot of people drive uh those bidding wars with emotion as opposed to logic. And uh for the house that we saw, for instance, it was on the market for 929. Beautiful house, newer major systems, you know, roof, HVAC, windows and doors, but unfinished basement.
And in the same neighborhood for a full 15,000 less for 906, a little bit more than that, right? 19,000 less, 906. The house, the most recent comparable sale, similar condition, had a finished basement, and it was 4 to 500 foot more above grade. By the time that the multiple offers were done with this house, it was almost a million dollar. It's a full like 70,000 above ask. And I didn't think that that house would have appraised for more than$875 to 900.
So, my clients uh chose not to participate in that. But I think that for those of uh for those of I don't if you're watching this, you're stats driven, you know, and you're probably not going to lead with emotion when you're making these offers in the marketplace. So, you're not who I'm talking to when I say this, but there's a lot of people making these offers based on emotion right now who are going to find themselves upside down on these mortgages.
If life happens and they have to sell, they're going to have to look at a short sale situation if there's a financial hardship. Otherwise, their hands are going to be tied because they're going to be overspending on properties. Now, I don't think that this trend is going to continue over the course of the year. I don't see multiple offers happening everywhere this year. I think people are excited about the market, but I think that right now you have a couple people who are out in the markets early.
Inventory is still kind of low in these uh parts of town. Like, we're not seeing a ton in the price ranges that we are searching in uh in that North Atlanta region. So when something nice pops up, it's getting a lot of attention right now. So as a home seller, take advantage of that. If you are getting ready to put a house on the market and you're in like Roswell, Alpharetta, Johns Creek, East Cobb, Milton, that's a great great part of the um market right now in metro Atlanta that just has a ton of early um and we're going to see when we look at the showings here in just a little bit, but there's a ton of early interest and demand in those markets.
Overall market overview 30:59
So you can take advantage of that as a seller. So, if we were headed towards a crash, we'd start to see these prices come down significantly. And we're not seeing that. So, across the metro right now, the overall price is 421. And for the longest time, when I would come on and do these videos, I'd say, "Hey, the median home price is 425." And it was like that for a very, very long time.
So, 425, 425, 425. And over the past couple of months, it's been on a downward swing. So, the median price for the overall market is trending down, but that's not because of single family homes. Single family homes has been relatively flat. We're at that 445 and it's been like that for a while. What's causing the median overall price to come down are town homes. So, town homes have gone from 395 down to 385.
And it's because of an over supply. Uh there's still a lot of demand for town homes, but because they're so cheap to build, um builders have starting have started to overbuild these in many parts of town. And now there's just oversaturation. There's way more supply than there's demand. And I know for a fact there are people who are finding themselves upside down on a brand new build that they bought two to three years ago in some parts of town.
and you know and then it's it sucks um because you know you bought that property hoping that it would appreciate but in the short run it's gone the other way. So if you are one of these folks who bought a house and you're upside down on a brand new build like that uh if you have a long enough time horizon it doesn't matter right but it's if you're trying to move in the shorter run uh it complicates things.
Condos are down a little bit as well. 300K we're at 296. Let's dive into the numbers as we take a look at the overall market. So, inventory trends first. So, activives are up because at this time of the year, people are done with the holidays and they're listing their homes. So, new listings are up significantly. That pushes active inventory up. So, it's no surprise then that failures are down. Those are your expireds and your withdraws.
Most of those happened in October, November, December as people exited the market to take a break for the holidays. Now, they're coming back. So, of course, closings are down. We talked about that. And pendings have been on a downward swing as well. This is another sign of initial optimism in the market. And this January, we had the most showings happen basically since 2022, which is good. There's more people out looking. They're just not yet buying, right?
When you factor the amount of closings that we had or pending properties, properties going under contract in 2023, well, there were 5,000 less showings, but there were quite a bit more, 1,600 more properties going under contract. So, every single year, these pendings have been trending down, and we're at 2703 right now for 59,000 showings. But, I think that that's a lot of people are out looking. their time frame might uh be a little bit more if you have a family, you're probably going to time the school year a little bit closer, right?
So, you might be out looking a little bit early, but you're not ready to buy just yet. So, I think that that's part of what's driving that. Uh the other thing is I think that people are looking at some houses in different parts of Atlanta and they feel like prices are just too high. So, they're out. They're waiting to find the right fit and they're not going to most people aren't willing to overspend for a home right now.
Unless you're some of these people in Roswell, Alpharetta over bidding these $900,000 houses. New listings by month. Uh we're starting the year here. So, we're a little behind where we were this time last year by about 300 or 260 listings or so. It's negligible. Uh take a look at the active inventory and we're above. So, at 16,410, we're outpacing last year by 1,400 listings and significantly the year before. So, there's more inventory coming to market.
We'll see how this trend goes over the course of the year. Pendings are down. So, here's pendings. We're quite a bit under where we were this time last year. You know, that is almost a thousand less properties under contract in the month of January and significantly over two years ago, right? That's 1,400 less or thereabouts. Uh closings are also going to be down. We we've got the least number of closings, the fewest number of closings since uh 2011.
We talked about that the beginning of the video. And then failures, uh, we'll talk about that when we look at the different counties specifically. Now, median days on market will tell us how long a property is sitting on the market before it goes under contract and closes, right? Until it finds the buyer. So, condos are leading uh at the half of the market, it's 54 days on the market. 43 for town houses overall is 33.
And of course, uh, single family 29, there's a lot more single family. The market is more robust than the condo and townhouse market. Uh, nonetheless, you can kind of see back uh, as that period of exuberance ended, you know, all of these were about the same and now they're starting to be divergence and people the single family home market will always be relatively strong in metro Atlanta. the town home market and the condo market right now are opening up and there's some really interesting buying opportunities that will be developing over the next little while.
So, if you're a condo or a town home would be buyer, starting to get interesting. So, list to sales ratio, uh, you're getting some pretty nice discounts. Look at that. How it was all about the same and now it's starting to open up for condos. So, 5.4% is uh the discount that you can expect by default when it comes to condos. And of course, real estate is very hyper local and very specific.
So, the right property could come to market at the right price and right condition and sells for above asking, right? That still happens. Uh but in general, condos are selling for under ask. Now, so are town homes and single family. Single family are getting about a 4.1% discount unless you're in Roswell, Alpharetta right now. And uh town houses 3.8%. So keep that in mind. Now, we're going to take a look at the type of market that we're in.
So the 5 to 6 months worth of inventory of supply here is this shaded yellow area. This red threshold is where the market goes out of balance and starts to favor buyers. Condos, if I think that there's a season in someone's life where a condo or town home is exactly what the doctor prescribed, right? And now condos, there's just so many of them that they're now in buyer market territory. We're going to look at another metric that talks about what kind of a market we're in, but this is a really good one for months of supply.
So town houses are trending towards balance. Single family at 3.8. It's going to take a little while longer to get there. If you take a look at this time last year, single family in January was 3.1. So it's up.7. if it continues this trend, um you know, you you'll still be underbalanced this time next year. Uh but town houses are going to be in balance and eventually this market will 100% my prediction uh find itself in a buyer market as well for the overall metro.
Uh but right now for town houses, it's a buyer market in many parts of metro Atlanta, but overall right under balance. It's close though. So the petting ratio is a different way of taking a look at what kind of market it is and it takes a closer look at absorption rate. They both do. Months of supply does as well because with months of supply, it shows you if nothing new hits the market, approximately how long would it take to liquidate the current inventory.
Pending ratio looks at how many properties are going under contract in a given time period. So in a balanced market, you typically see 18 to 25% of the listings every month go under contract. So, right now for condos and we're going to look again, we're going to break this down by county. We're going to break it down by property type. Some stuff I'm going to talk about in this video. The slide deck is huge this month.
I put a whole bunch of extra time into research and data analysis. I don't think I'm going to have all the time in the world to talk about it in this video, but the slide deck is free. You don't even have to sign up for it or register with your email or anything like that. Just click the link in the description and in that first comment and it's yours if you want to look at it on your own time.
9.4% is basically saying that for every 10 condos that are on the market in a given 30-day window, one is going to go under contract, nine are failing to sell. That's not very good, right? Single family is just just under balance at 17.4. So, it's slightly worse than one out of five, not quite one out of six, uh, but it's one out of five and a half properties if you can look at a half of a house as an example.
So they're they're moving relatively well on the overall metro standpoint. Town homes are at 12. So it's like one out of eight, one out of nine properties uh are going to go under contract. Uh if you take a look at the metro, so definitely for condos and town houses, we are now in a buyer market from this perspective as well. And single family, I mean, you're technically I mean, you're technically bal uh I'm sorry, buyers, but you're so close to balance.
I mean, this is really going to depend. I think that the seasonality of it is going to swing it back into balance as we go into spring market, but not for town houses and condos.
Single family home stats 40:14
So, now this is the part of the video where we're going to take a look at the different property types individually. So, if you're not a single family home person and you want to look at town homes or you want to look at uh condos, feel free to take a look at the chapters that I have in the video and skip ahead to what interests you because we're going to get very granular with uh what these values are, these metrics are for the different counties for these different property types.
So, if you are into single family homes, this is what we're starting with. So median price for Atlanta is 445. And year-over-year, you've got a lot of different counties that have had some very slight upticks. You know, Cherokee 502 to 509. Uh Cobb is up slightly. Uh basically the biggest pullback is in DeKalb County where we went from 398 down to 382. It's roughly a 4% drop in the median price. Uh so not too many surprises.
I think you will see um an eb and flow to certain areas going up and down you know but ultimately the market as a whole has been pretty stable at that 445. So more opportunities presenting themselves in dec right now with the 4% reduction in price. Now when we take a look at this from a different perspective we want to see where the activity is happening and yeah you're going to have the big four.
So, Cobb, DeKalb, Fulton, Gwinnett. These counties have the lion share of activity of showings. So, these are showings that happened all in the month of January. The blue line is this year. The black line is last year. You can kind of see that activity across the board uh for some of the biggest counties up with the exception of DeKalb. Uh that might explain why prices have come down there a little bit as well.
There's a little bit less people. There are less people looking. This is a big jump also in Cherokee County from 3,300 showings all the way up to 4,700. That's a proportionally speaking a big big jump up. So some of the outlier counties, I mean foresight, not much of a jump there. Um you know, let's keep moving on basically, but that gives you a good idea of where the market is looking for houses right now.
Now, showings per listing uh by county. This is going to give you an idea of it puts the counties on an even playing field because when you compare a Fulton County which has tons and tons and tons of houses to a smaller county like you know Clayton or Fayette for example there are less uh you know residences. This helps to put it on a level playing field. So nonetheless you're going to see that demand is still higher in Cobb DeKalb Cherokee uh Forsyth Fulton and Gwinnett.
These are the counties that most people are looking for houses in right now. But that's not to say that, you know, places like Clayton, Douglas, Fayette, Paulding, and Rockdale aren't being looked at. They are, and you're going to see that these are some of the more affordable counties, and I've got some good stats coming up on these as well. There's some nice buy opportunities uh in those counties. If you want to live a little bit on the outskirts, but get more house for the money, they're great places to look right now.
So, in terms of new properties coming to market, here's the distribution by county. Nothing really stands out too too much here except that in town you have less listings coming to market in DeKalb and Fulton. Meanwhile, on the outskirts, uh they're up pretty much everywhere, right? So, suburban uh inventory is on the rise. Urban inventory is not coming to market quite as much as it did the year earlier. We'll see what that does for in town pricing.
Now, moving along, we'll take a look at active inventory. And if you have less new properties coming to market, it's probably going to affect your overall inventory. And that's what's happening here in DeKalb and in Fulton. But look at the active inventory in Cobb and in Gwinnett. Now Cobb and Gwinnett have been so close uh in terms of real estate, both prices, sales volume, like a lot of different metrics. Now you're starting to see Gwinnett start to pull away a little bit in terms of active inventory.
They've been building so many new neighborhoods out in Gwinnett uh that uh it's starting to really build the east side of uh the county, right? So everything that's close to the I85 corridor, a lot of that's been built up, but east side of Gwinnett is now starting to really get built up. So in terms of properties going under contract, you've got less everywhere. We talked about that for the overall market here.
It's reflected in single family homes across the board in town. And these are big drops. And what goes under contract this month closes next month. So next month I expect that we'll have quite a few less uh closings as well in some of these different areas. It's not up anywhere across the board. Closings, same thing. If there are less properties going under contract, there'll there are less properties that close. And when we did this video last month, pendings were down.
So it's no surprise that also this month closings are down. That's a big big jump down, right? When you take a look at the number the uh the the lesser number of closings in Fulton and DeKalb Cobb like the big four had big big pullbacks. Now failures seem to be up across the board but there was a pullback in Fulton. Um everywhere else people have tried the market and then either the property expired or got withdrawn and you're going to see them come back to market most likely.
So days on market for single family homes it's if you've got a home in metroana it takes an average 29 days. If you live in these different counties, they're moving fastest right now in COP. And then after that, most of like Cherokee, DeKalb, uh you take a look at Fulton and Gwinnett, they're all close to that metro Atlanta baseline where it's taking a little little longer to sell houses right now are some of the south of I20 uh perimeter counties like Clayton, Douglas, Fayette, for example.
You know, Paulding is not south, it's north of I20, of course, but things are a little slower there as they are in Rockdale. If we take a look at months of supply, fate and Rockdale have entered balance market. Everywhere else for single family is generally still a sellers market, especially in COP at 3%, Cherokee strong at 3.4, four, Gwinnett at 3.5. And then these other counties, DeKalb, Douglas, Forsyth, Fulton, uh, Paulding, they're they're still doing quite well as well.
But the strongest markets right now are definitely in Cobb and Cherokee. When you look at supply, when we look at the penning ratio, it's again a different way of looking at what kind of a market we're in. Fayette, you got a lot of these counties that have now gone into buyers market territory. when you look at it from this perspective, fade it, one out of 10 houses that's on the market goes under contract in a given month.
So that's not a lot of movement. So if you're on the market and fade, it might take a little while longer. Definitely want to make sure anytime that you're on the low end of this and you have very few properties that are going under contract in a given time period and you're selling your house, being well priced, knowing how to price relative to your condition. You don't have to be perfect. You just have to be priced well according to the condition of the house.
and then make sure that you have the best marketing you can possibly get for exposure purposes, you'll sell. So, it's a question of how do you how are you perceived in the marketplace relative to your neighbors? Because when you bought your house, you did the same thing. You were comparing, well, what does this house have compared to this house? Well, they're asking this for this price, but that one's got the new roof and the new AC.
This one has the lipstick on a pig investor special and the kitchen and bathrooms. And gosh, when you walk in, I smell mold. Well, we'll probably go for this house here, right? They're about the same price. So, you're always comparing your house to other houses. And so, it's tough, but you take a step back. And that's where working with a professional, working with your favorite realtor, they can give you guidance on what's important to focus on so that you can kind of figure out how to price so that you're not one of these nine properties that are sitting on the market because one of the neighbors went under contract, but it wasn't you.
if you're in fate, you know, these other uh counties, almost one out of five in Cobb. Um really that Cobb is the only one on this list that's still in balance. And you kind of see last year it was firmly in sellers market territory there. So there's definitely a shift happening even in single family, which makes the opportunity to buy single family better this year than it was last year uh based on these numbers.
Now the list to sales ratio. Let's take a look and see what sellers are actually getting. So mentioned that Cobb is relatively in balance comparatively speaking or sellers market if you look at months of supply. Uh it's also getting the highest list to sales ratio. So 3.3% discount is what people are getting off of the asking price uh or the original asking price is what those homes are selling for. So Cherokee is pretty close as well at 3.4.
The baseline in Atlanta. Um, you know, you've got some counties that are well under that. So, if you want to be in a perimeter county, get more house for your money, and you want to live in Clayton, for example. Well, Clayton selling at a 5.4% discount on average for single family. You get some good deals in Fayette. You take a look at Rockdale, for example. So, there there are some nice opportunities there.
Uh, DeKalb in town, 95.2 and, uh, Fulton 95.4. those are markets that are a lot closer to the action, right? And you still get some nice opportunities there. So, so it's always interesting because when you own the house on paper, you're like, "Yeah, I want it to be worth as much as possible." And it's true until you get the property tax bill and you find out that the city or county has, you know, adjusted the millage rates again.
And this year again, your property taxes have gone up. So, um, ultimately the price of the house in a perfect world, if it could shoot up right before you're ready to sell, that would be ideal. So, let's take a look and see what kind of reductions we're seeing in the market, right? Like what kind of price cuts. So, this is a chart that I like to do every single month. And take a look at DeKalb.
I mean, that's uh 50% of the active listings, one out of two properties that are on the market currently have had a price reduction. And of the properties have had a price reduction, they've averaged a 7% drop in price. Everywhere else, it's between four and five, sometimes 6%. Take a look at Fulton. It's at 7% as well, but it's only a third of the properties that have had those reductions. So, does that mean that there's an opportunity for the other two-thirds to potentially drop their price?
Maybe. Um maybe they haven't gotten there yet. And that's where we're going to compare active to pending. Uh but this kind of gives you an idea of where the market is in terms of pricing too high and then realizing that. And you start here and then you drop the price and you try a new price and see how the market's going to react. And these are some big numbers, but it's hard to quantify like that.
So, uh, two two slides from now, I'll show you some actual numbers, but let's see how active compares to properties that went under contract because the ones that went under contract will show us what type of price reductions were needed right before they went pending. So, these numbers are a lot higher. So, it was 7% for uh, DeKalb. Well, to go under contract, it took 8.5%. in Fulton it was 7% but to go under contract it took 8.4%.
So um a lot of these properties that have had price reductions this is to say that when you make an offer you can still negotiate off of the price a little bit because sellers are willing to sell for a little bit more than what they've already reduced their prices for. But from four to 5% maybe six now you're seeing more 6 to 7% and the highest on this list is over here in Rockdale.
So I mentioned uh south of I20 perimeter counties. You get a little bit more for your money. You're also getting really good deals on uh single family homes right now in Rockdale. Now let's take a look and see what the percentages look like in terms of numbers. So this is active versus pending. So, we were talking about DeKalb. So, that 7% average is an average of 30K. And then the 8.5% works out to be 34K.
So, people needed to reduce by another 4,000 in order to go under contract. So, we won't know what they actually close for until they close. But that's where you look at list to sales ratio at that point. Um, you take a look at Fulton for example, 50K and it's marginally more. Or I know that they're both 50K here, but you're looking at decimals difference. But look at Rockdale. We just got done talking about Rockdale.
So the active properties are at 21, but they need an extra 13,000 at 34K in order to go under contract. Um, and then same thing for like Cherokee. That's a nice big jump up. So, you know, you're seeing some of the properties that are active, maybe the sellers will take more. Maybe when they do that final push where they have that reduction, then they go under contract, they need to push a little bit more.
Uh if you're selling your house and you've been on the market for a little while, you're over the median days on market and you're seeing that you've that you're closer to these numbers. Well, it kind of shows you where you would need to be instead. Now, that's a bad example looking at Fayette because the pendings uh needed only 37 to get there, but that also could mean that they were better priced to begin with, right?
So, it's it gives us there's a lot of data points, a lot of things to consider.
Townhouse stats 53:32
This is an overview. So that now brings us to town houses. So the median price house for a town home is right at 385. You don't have a ton of pullbacks, but it seems like year-over-year they're down almost everywhere. They're not up practically anywhere except for Clayton. And Clayton doesn't have the most town homes, but they're starting to build more. And I think because of that, that's going to push prices up a little bit as the market opens up in Clayton.
So, moving on, we'll take a look at showings and see what I mean. Like Clayton, year-over-year, that's almost a hundred more showings in the month of January, uh, for a market that's developing. Well, same thing for Douglas, same thing for Rockdale. Town homes are cheap to build. I think that you'll see more and more municipalities approve them, and you're going to have more builders building them. Uh, but Cobb, DeKalb, Fulton, Gwinnett are still the biggest counties for town home.
And of course, Cherokee, Woodstock, Town Home Central, right in Woodstock. So, that brings us to new listings by county. They're down a little bit everywhere in the big uh three, up a little bit here in DeKalb. Active inventory, no major surprises here, uh except that from a town home perspective in DeKalb, that's a lot more uh town home listings on the market this year than last year. It's 111 more properties. So that's not insignificant.
Let's look at the ones going under contract though. So even though there's more inventory in DeKalb, that's a big drop down in the number of actual town homes are going to uh under contract. Same thing when you take a look at Fulton. Same thing when you look at Gwinnett's. So there's a lot of inventory, a lot less of them going under contract, which explains why there's starting to be a negative pressure on price.
and you go from an average of 395, median uh price of 395 down to 385 year-over-year, that trend is going to continue. You look at closings, if pendings are down, these next month uh won't have these numbers. They'll be a little bit lower as well, but they're down as well. And then see what I mean about like Clayton and Rockdale and uh Douglas. These are not the biggest town home markets yet, but I think over the next decade, uh, you'll have a lot more being built out that way.
And then failed listings. There are a lot of failures because they try to price sit there, they have to get relisted, and so they're up across the board. Median days on market. So, it's taking 43 days uh, is at the middle of the market to sell a town home. Some places taking more. So year-over-year it's up across the board um big time in Forsyth County. That's a big jump from 16 days to 37.
Taking a look at what kind of a market we're in, well it's no surprise that year-over-year, many of the different counties have now found themselves in a balanced market territory for town homes. Uh Forsyth County and Cobb are still sellers markets. Gwinnett as well. Fulton to a certain extent is right there crusting balance. If we look at the pending ratio, um, Douglas was again not the biggest town home market, but that's a big jump one way.
You had a whole a whole bunch of property sold last year and now this year they're just kind of sitting, right? Um, but a lot of these black lines were in balance last year and now they're in buyers market territory. So, if you're in the market for a town home, uh, I mean, this is the time. take a look at what the list to sales ratio is and you're getting four to 5% discounts across the board.
I'd be aggressive with my offers even even with new construction. I think you can push builders uh quite often as well and they're willing to give you more than what they advertise. Um I know that for a fact builder will say no no no and then you play your cards the right way and they're like wait come back. Okay, what do we need to do to make the deal happen? and then you're surprised by what you're able to give sometimes that they say no to for the first eight times.
Um, okay. Active listing price cuts for town homes. So, I've removed uh we're not covering a full 11 counties because when you take a look at Fayette and Paulding, there are like zero town homes honestly. So, we're focusing on the other nine. And so for the other nine, just as we saw in DeKalb and um you know rough and for Fulton almost half of the listings and almost a third of the listings have 5.8 and 5.5 reduction in price, but some of the biggest reductions on town homes have been out in Douglas County.
Not a bunch of inventory. We saw that. But the ones that are on the market are starting to drop their prices. Now, for the properties that are pending, if it's zero, it's because there are zero town homes pending in those counties. So, I can't get a stat. So, it goes to show uh but look look at the difference here. So, we talked about uh for instance um DAB at 5.8% and 5.5 for Fulton.
And then that jumps up from 5.8 to 7.3 and 5.5. I guess town homes in Fulton are better priced because the ones that went under contract didn't need quite as big of a price cut as the ones that needed to go under contract into cap. So this is definitely a big uh jump up from 5.8. Um, and then moving along, let's take a look at average price cut dollar-wise. So, some of the biggest price cuts, you know, Douglas, again, not a ton of properties, but the ones that are on the market have had an average of $26,000 cut off of their price.
So, there's a lot of 20,000 plus across the board here, right? Um, so better deals on town homes is what that tells me.
Condo stats 59:29
Now, condos. We're focusing on four condo four counties. There aren't. While there may be condos in some of these other counties, they're typically ranch condos. The volume, the number of units are so small that it really skews the stats to focus on them. So, when we think condos, when I think condos, I'm thinking buildings. Whether they're skyscrapers or garden rise or some mix in between, if you're a little bit more cobbwinet, you'll have a higher concentration of ranch condos.
There's a lot of 55 plus neighborhoods that qualify as condominium associations as well, but you still have buildings nonetheless, right? So, that's kind of what we're looking at. So, the median price of a condo is uh 285 we said uh or 295 down from 300. And um you know, in Fulton's down year-over-year, my red's going to blend in. Let me make that blue for the condos. So, condos in uh Fulton are down year-over-year.
Prices are down in DeKalb. Prices are down in Cobb. And they're up year-over-year slightly in Gwinnett. So, let's take a look at where the showing activity is. Fulton, is it any surprise? That's where all the condo buildings are, right? So, year-over-year showings, interest in condos are up. That's what this is. Or interest in condos is up. I can start that over. So, next, let's take a look at where the interest is in the market.
And year-over-year interest in condos in Fulton is up. Same thing with interest in DeKalb and Cobb. A little bit of a pullback in Gwinnett, but you kind of see what the concentration is. We saw that showings were up across the board. Uh it's kind of like that in the condo market as well. And then new listings, there's a significant number of listings coming to market in Fulton. It's a much bigger market.
A little bit of a pullback in some of these other counties, but not much. Active listings, you've got 1,261 condo units to choose from in Fulton right now. They're up across the board. A little bit of a pullback in Gwinnett's. Pending listings are down. We saw they were down across the board, right? But they were up a little bit in Gwinnett. Uh but for the Atlanta market as a whole, they're down. So, it's not super surprising to see a drop in Fulton and in DeKalb and Cobb, for instance.
Now, closings. Let's see where we're at here. A little bit of a pullback. Now we're getting to failures, but I want to see buyers market, right? We're going to take a look at how long it's taken to find a buyer. 46, 47, 59, and 79 days. These are big jumps up year-over-year. And then if we look at months of supply, well, every single market is in balance or in a buyer market.
So for the two in town markets which arguably have the most number of condos, it's a firm firm firm uh buyers market there right now. Now from a pending ratio perspective really only Gwinnett is in balance. Uh take a look at Fulton and DeKalb and Cobb and now gosh I mean that's one out of 12 one out of 13 properties that are on the market goes under contract in a given time period in 30 days and Fulton's one out of 10.
So if you're in the market to buy a condo again you can be very very very picky because there's a lot of inventory too. You can be more aggressive with your pricing and you should expect better discounts and concessions and so forth. If you're a seller, the reverse in order to be successful, make sure that the property is in the best condition that you can possibly get it in. Make sure it's priced appropriately.
And appropriately doesn't necessarily mean fair market value. When pending ratios are this lower, you kind of want to price it a little bit under where you think it's going to sell to get ahead of where the market's trending. And the market is trending down for condos and town homes right now. So, that brings us to the listed sales ratio. And you get some big discounts into cab. 6.1% off the price. Fulton is 5.6.
If we look at actual reductions, the reductions in DeKalb, uh, a lot of these listings, Cobb and DeKalb, half of, uh, all the condos have had reductions. 5.4% average in Cobb, 8.2% in DAB. Now, what does that look like for pendings? So, pendings, wow. So, we went from 8.2, too. But the properties that had, see what I just said about being a seller and and positioning your properties to go under contract.
The ones who did uh for condos in DeKalb reduce their prices by 15.2% on average. Well, 29% of those did, which means also, if we're looking at it objectively, that 70% didn't need these reductions in order to go under contract. Nonetheless, those who did reduce, they had to reduce significantly in order to attract a buyer. And then the average price cuts for the listings uh that did cut uh versus active versus pending.
You can kind of see the big spread here in DeKalb. There's a big spread also in Gwinnett. Cobb and Fulton are a little bit closer. So in looking at the data, I don't think that we're headed towards a market crash. Do you? Looking at this, there's no question that we're in a correction, especially when it comes to town homes and condos. Now I don't think I think people want to know if the market's going to crash, but I don't think that's the biggest question.
I think if you're watching this, you're trying to find out whether or not it's the right time for you to buy a house this year. And if that's you, watch this video next. I created a framework that helps people understand their unique set of circumstances, and then it helps them decide whether or not buying is right for them. Sometimes it's not. Watch the video to find out

About Terence Richardson
Terence Richardson is a Realtor with Compass and the founder of the Terence Richardson Group, which serves Metro Atlanta. He publishes Atlanta’s Housing Market Update every month on YouTube and in The Richardson Report.
